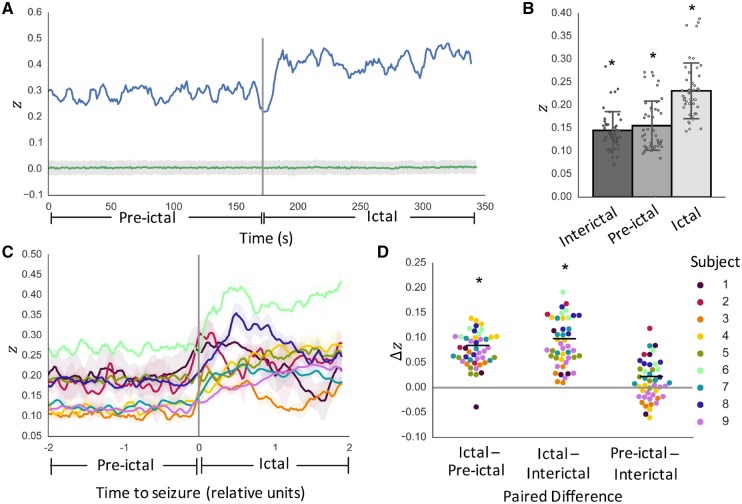
Figure 2.
SC-FC analysis using broadband functional connectivity. (A) Temporal dynamics of SC-FC correlation as measured by Fisher’s z for one example seizure in one patient, along with permutation-based null distribution of z values (mean ± standard deviation). (B) Per-seizure z-values during interictal, pre-ictal, and ictal periods reveal SC-FC correlations significantly greater than chance across all periods (P < 0.05). (C) Temporal dynamics of SC-FC correlation across all subjects (mean ± standard deviation across seizures in each subject). For visualization purposes only, time courses were normalized to span 200 evenly spaced time windows (100 pre-ictal and 100 ictal) and smoothed with a 5-window moving average filter. (D) Per-seizure paired differences in mean z-values reveal significantly greater SC-FC correlation during ictal periods than pre-ictal periods (P = 0.023). This effect holds when substituting pre-ictal periods with interictal periods (P = 0.021), with no significant difference between pre-ictal and interictal period SC-FC correlation values (P = 0.70). *P < 0.05.

