
FIGURE 8.
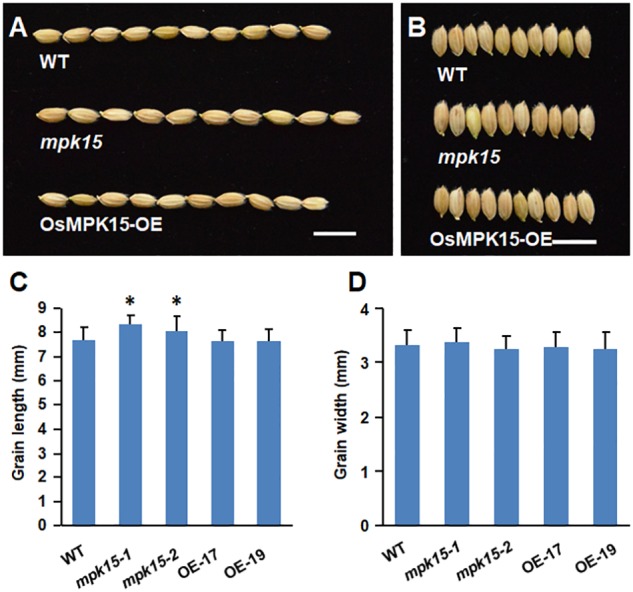
Grain length and width of the WT, mpk15 mutant, and OsMPK15-OE lines. (A,B) The phenotype of grain length and width from the WT, mpk15 mutant, and OsMPK15-OE lines. Bars indicate 10 mm. (C,D) Statistics of grain length and width (n = 300), respectively. ∗P ≤ 0.05; ∗∗P ≤ 0.01 (Student’s t-test).