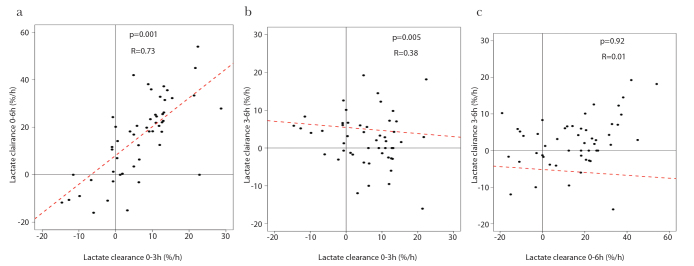
Figure 1. a–c.
Correlation between sequential measures of LC
LC was calculated between 0 to 3 h (0–3), 0 to 6 h (0–6) and 3 to 6 h (3–6) after the initiation of ECLS. Correlations were evaluated for LC between (a) 0–3, (b) 0–6 and (c) 3–6 and between 0–6 and 3–6 h. LC is expressed as percentage per hour (%/h). LC: lactate clearance.

