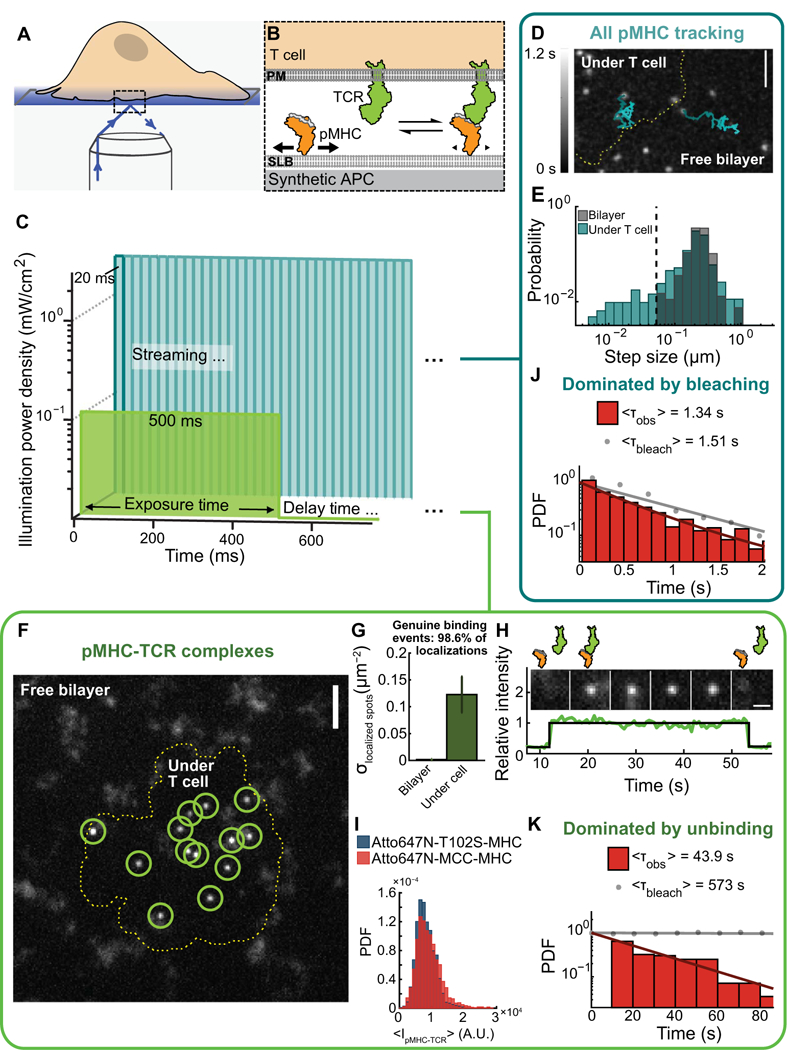
Fig. 1. Detection of single pMHC-TCR binding events that initiate T cell signaling.

(A and B) Outline of TIRF microscopy experiments in which live, primary T cells form interfaces with its plasma membrane (PM) and a supported lipid bilayer (SLB) and the intermembrane junction is selectively imaged (A). Within the lipid bilayer, freely mobile pMHC (bold arrows) experience rapid diffusion, whereas TCR-ligated pMHC (small arrows) have reduced mobility (B). (C) pMHC-TCR binding events were detected either using short exposure times and high-power intensity by streaming acquisition (no delay time between frame) (cyan) or using long exposure times and low-power intensity at matched energy input after a delay time (green). (D)Sin-gle pMHC trajectories observed using short exposure times and high-power intensity microscopy imaging of the T cell contact site (dashed line) and supported membrane. The trajectories (n > 100) are representative of at least three independent experiments. Scale bar, 3 μm. (E) Step-size distribution of single MCC pMHC molecules shows bimodal mobility under a T cell (cyan) and unimodal mobility on the free supported membrane (gray). Step sizes were calculated for all steps in >4000 trajectories from three independent experiments. (F) Localization of single pMHC-TCR complexes using long exposure times and low-power intensity imaging in the free bilayer or under a T cell (dashed line). Images are representative of at least 20 independent experiments. Scale bar, 3 mm. (G) Density of localized particles on free bilayers and at the T cell contact site. Data are means ± SEM of three independent measurements. (H) Single pMHC-TCR binding and unbinding over time determined by microscopy. Images (top) and intensity traces (bottom) are representative of 20 independent experiments. (I) Single pMHC-TCR complexflu- orescence intensity distributions determined by microscopy. Probability density function (PDF) plot of the mean intensity of the 2×2 pixels around a localized centroid for all steps in all trajectories is from three independent experiments. (J) Dwell time distribution of MCC-Atto647N-MHC (red) using short expo sures and high-power intensity imaging with-out a time delay and corrected for fluorophore photobleaching (gray). Data are from the analysis of >2300 trajectories from five cells in three independent experiments. (K) Dwell time distribution of MCC-Atto647N-MHC using long exposure and low-power intensity imaging after a 10-s time lapse and corrected for fluorophore photobleaching (gray). Data are from the analysis of >1100 trajectories from nine cells in three independent experiments. A.U., arbitrary units.
