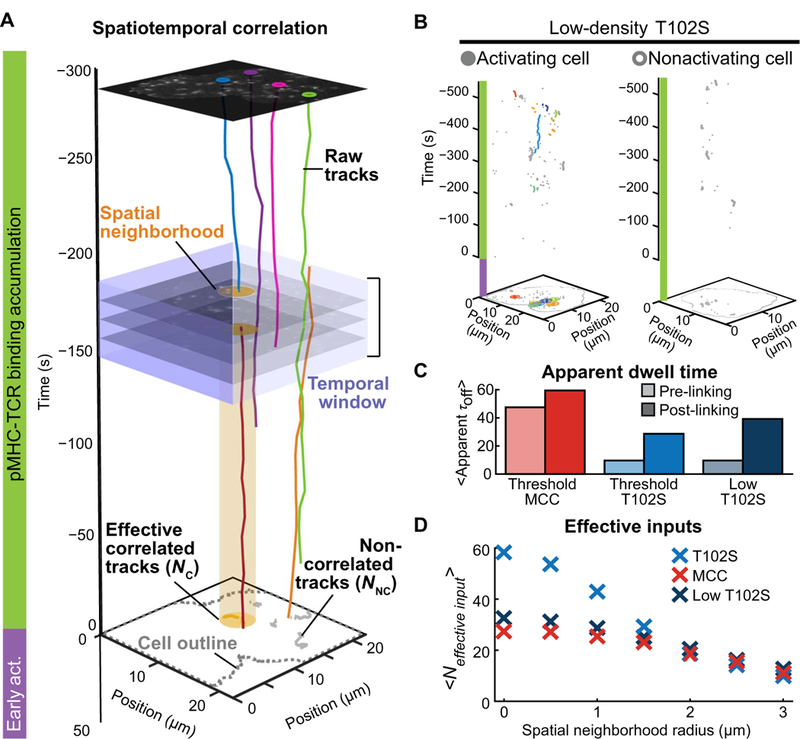
Fig. 6. T cells group spatiotemporally correlated pMHC-TCR binding events to create long-dwelling inputs.

(A)Schematic of the spatiotemporal correlation analysis. Raw data are shown with selected single-molecule pMHC-TCR trajectories that occurred while the cell accumulated impulses (green bar) before activating NFAT (purple bar). Correlated tracks were coupled given coincidence within a neighborhood (yellow disc) and a 30-s time window (purple square region) and require one trajectory to be initiated during that window. Trajectories satisfying these criteria were combined into an effective correlated track (NC) and displayed within a cluster on the two-dimensional projection of accumulated tracks (yellow). Trajectories that did not satisfy the criteria were considered noncorrelated tracks (NNC) (gray). (B) Representative spatiotemporal correlation of a cell that translocated NFAT (left) and one that did not (right) at low T102S pMHC density. Raw correlated tracks (colored) and noncorrelated (gray) pMHC-TCR trajectories were from the analysis of the data in Fig. 4. (C) The mean dwell time of cells that activated NFAT on threshold MCC pMHC density (red), threshold T102S density (blue), and low T102S pMHC density (dark blue) before and after spatiotemporal correlation (light and dark shades, respectively) is from the analysis of the data in Fig. 4. (D) Number of effective inputs after spatiotemporal correlation analysis of the data from Fig. 4 as a function of neighborhood radius.
