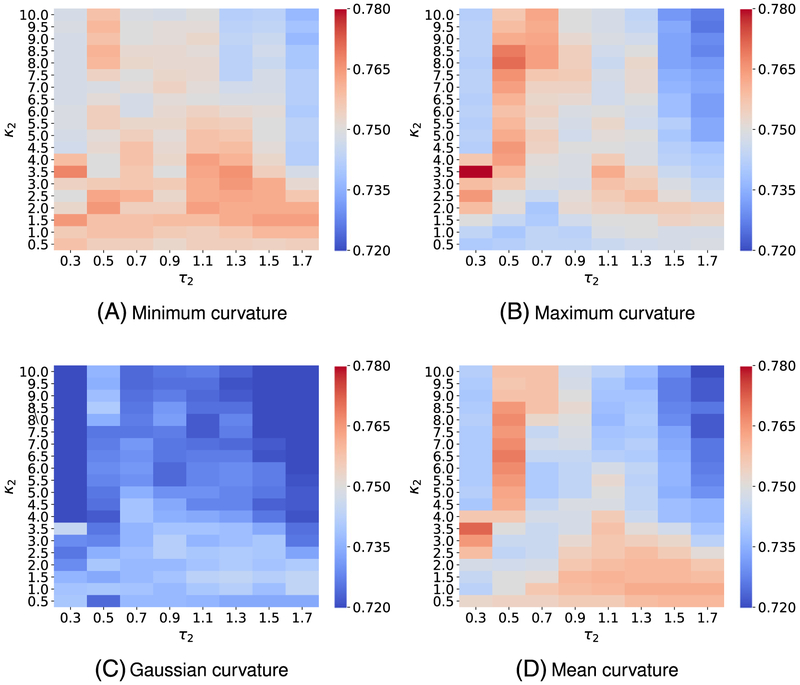
FIGURE A2.
Median values of R-squared correlations (R2) from four-fold cross validation performances of on the IGC50 training set are plotted against different values of τ2 and κ2. Two exponential kernels are utilized for features generation. While the parameters of the first kernel (τ1, κ1) are fixed and chosen from those reported in Figure A1, the parameters of the second kernel (τ2, κ2) are varied in the interested domains. The best performance for different kinds of curvatures is found as follows: A, minimum curvature: (τ = 0.7, κ = 10), (τ2 = 0.3, κ2 = 3.5) with R2 = 0.768; B, maximum curvature: (τ = 0.3, κ = 1.0), (τ2 = 0.3, κ2 = 3.5) with R2 = 0.780; C, Gaussian curvature: (τ = 0.7, κ = 10), (τ2 = 0.3, κ2 = 3.5) with R2 = 0.745; and D, mean curvature (τ = 0.3, κ = 1.5), (τ2 = 0.3, κ2 = 3.5) with R2 = 0.772

