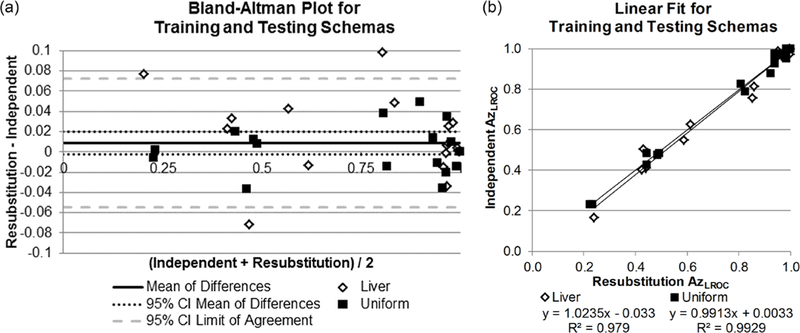
Figure 1.

Comparison of the training and testing schemas, resubstitution and independent training and testing cohorts. (a) Bland-Altman plot of differences in performances between the two methods. The confidence interval of the mean contains 0 (no difference). (b) The linear relationship between resubstitution (x-axis) and independent training and testing cohorts (y-axis). Linear fits for both liver and uniform water backgrounds have slopes near 1, y-intercepts near 0, and R2 values near 1, indicating good agreement between schemas.
