
Figure 5.
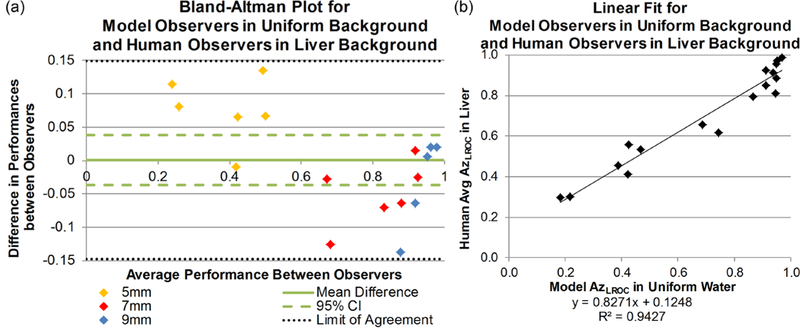
(a) Bland-Altman plot of LROC performance differences between human observers in liver background and model observers in uniform background, separated by size. The solid line represents the mean difference in performance and the dashed lines illustrate the 95% confidence interval of the mean difference. The dotted lines represent the limits of agreement (±1.96 * standard deviation) around the mean difference; all data points lie within this range. (b) Linear fit between the model performance data and the average human observer performance data. Slope and intercept do not achieve 1 and 0, respectively, and therefore do not demonstrate good one-to-one agreement.