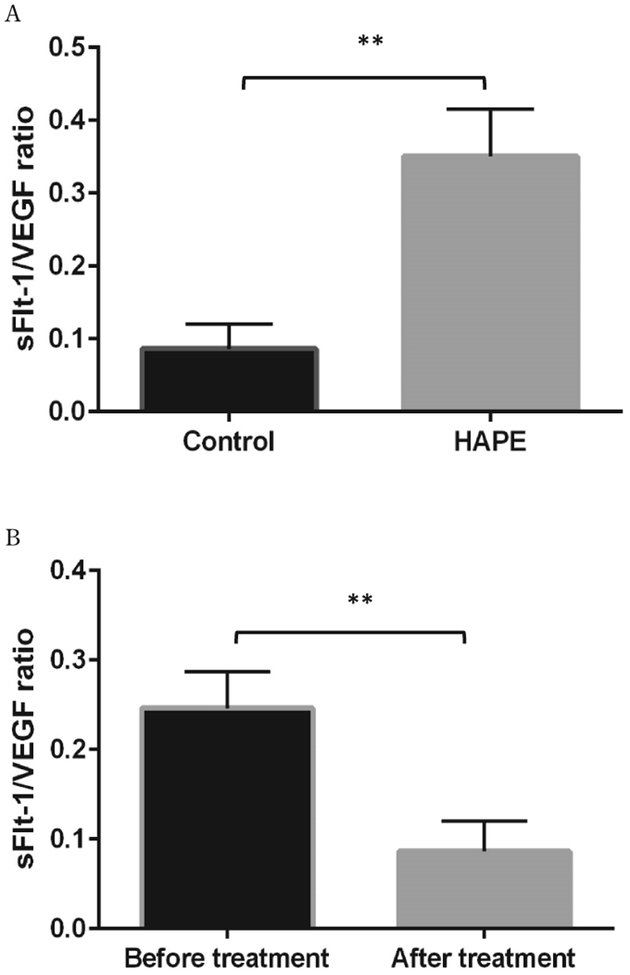
Figure 3.
The difference of sFlt-1/VEGF ratios between HAPE (n=10) and control groups (n=10), as well as between HAPE patients before and after treatments. A. The sFlt-1/VEGF ratio was significantly increased 4.05 folds in HAPE patients as compared to control subjects. B. The sFlt-1/VEGF ratio in the after treatment group was significantly decreased as compared with the pretreatment group. **p<0.01.

