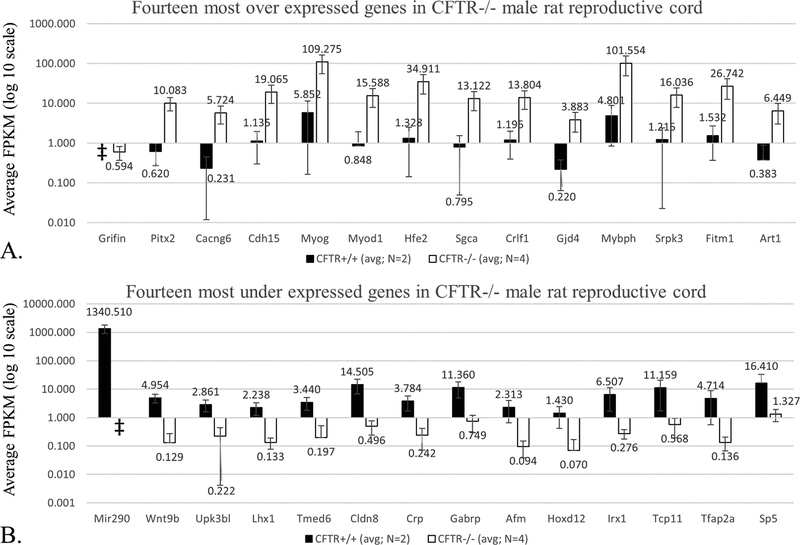
Figure 8: RNA-seq analysis reveals over- (A) and under- (B) expressed transcripts in CFTR−/− male reproductive cord at birth.
Graphical representation of FPKM (fragments per kilobase transcript per million fragments) for CFTR+/+ and CFTR−/− using epididymis, vas deferens, and surrounding tissue as source of mRNA. Complete dataset is shown in Supplemental Table 1. y-axis = log 10 scale; ǂ indicates FPKM value = 0, and not represented in this data format.

