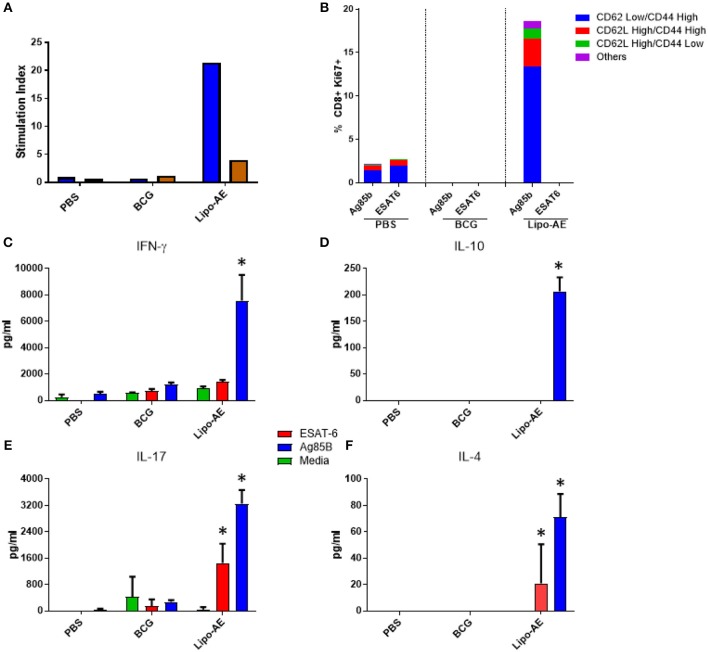
Figure 5.
Cellular immune response induced by Lipo-AE. (A) Antigen specific splenocyte and T cell proliferation. Splenocytes harvested from immunized animals were stimulated with Ag85B (blue) o ESAT-6 (red) as the recall antigens and media alone as the negative control, and proliferative responses were then measured by radiolabelled thymidine incorporation. Vertical bars represent the stimulation indices (stimulation index = antigen specific radioactive counts per minute/background radioactive counts per minute). (B) CD8 T cell proliferation. Splenocytes were stimulated with the recall antigens and the CD8+ Ki67+ cells identified. The gating strategy used was cells -> single cells -> live cells -> CD90.2+ -> CD8+ -> KI67+ and CD44/CD62L cells. The bars represent the percent of CD8+ cells that are Ki67+ and are broken down based on memory marker phenotype. (D,E,F) Cytokine production following antigen recall assay. Splenocyte stimulation culture supernatants were collected and assayed for cytokine presence by. Legendplex: IFN-y (C), IL-10 (D), IL-17 (E), and IL-4 (F). Bars depict means pg/ml ± SEM, with *indicating statistically significant values above the background (P < 0.05).

