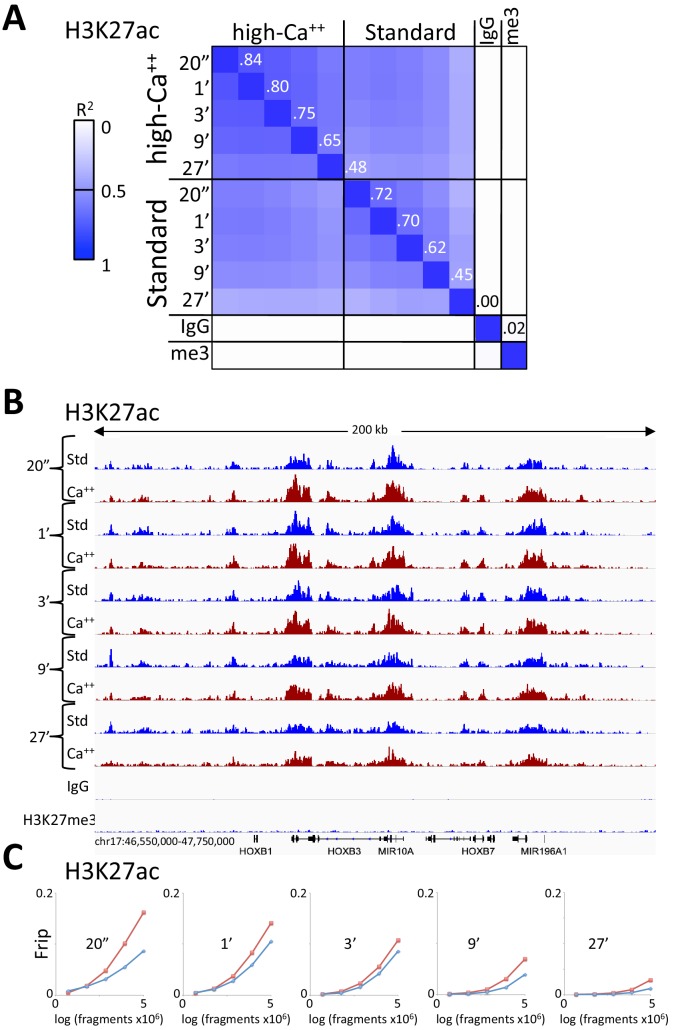
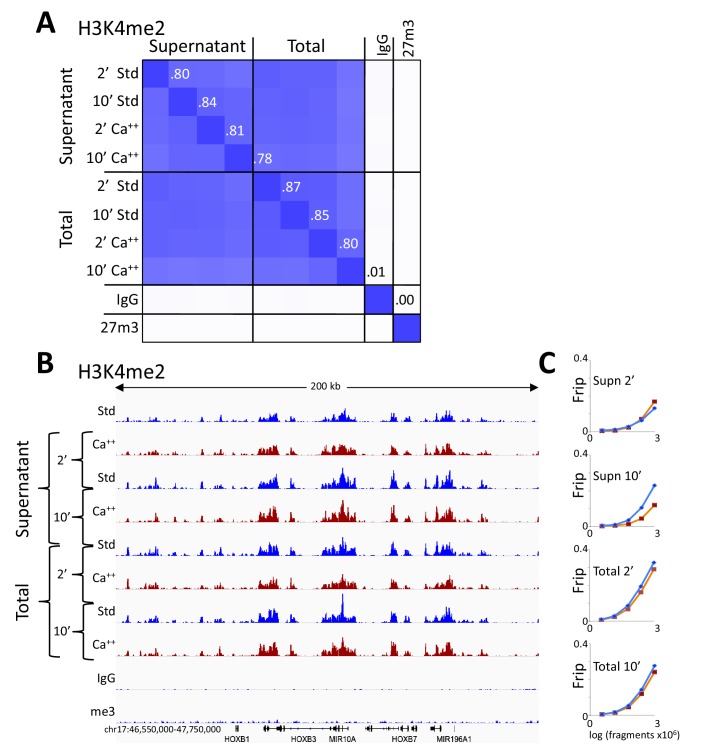
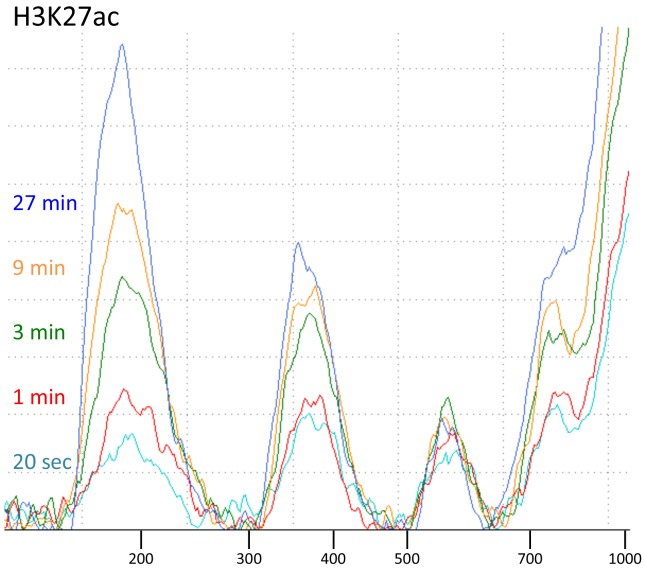
Figure 4. Consistent peak definition with high-Ca++/low salt digestion.
(A) H3K27ac CUT&RUN time-course experiments were performed with an Abcam 4729 rabbit polyclonal antibody, following either the standard protocol or the low-salt/high-calcium (High-Ca++) protocol. Samples of 5 million fragments from the 10 H3K27ac datasets were pooled and MACS2 called 36,529 peaks. Peak positions were scored for each dataset and correlations (R2 values shown along the diagonal) were calculated between peak vectors. IgG and H3K27me3 (me3) negative controls were similarly scored. Higher correlations between the High-Ca++ than the Standard time points indicates improved uniformity of digestion over the ~100 fold range of digestion times. (B) Tracks from a representative 200 kb region around the HoxB locus. (C) Fraction of reads in peaks (Frip) plots for each time point after down-sampling (5 million, 2.5 million, 1.25 million, 625,000 and 312,500), showing consistently higher Frip values for Ca++ (red) than Std (blue).


