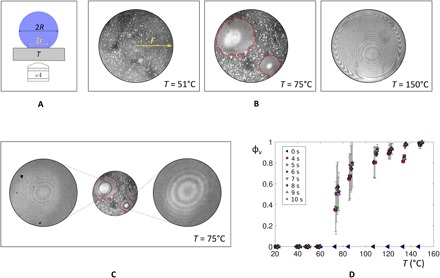
Fig. 4. Focus on the base of water drops placed on hot repellent substrates.

(A) Setup: A drop is deposited on a Glaco-treated sapphire brought to a temperature T. The contact zone is observed from below with an inverted microscope. (B) Visualization of the contact area whose radius r is 0.4 mm for a drop with radius R = 1.0 mm at T = 51°C (left), T = 75°C (center), and T = 150°C (right). Vapor patches appear around 70°C, and we highlight their contour in red. (C) Close-up on the fringes seen in the central region of the vapor patches seen in (B) at T = 75°C. (D) Fraction ϕv occupied by the vapor patches as a function of temperature T and measured 0 to 10 s after drop deposition. Each data point is an average over at least three drops, and error bars represent standard deviations. The bars are large in the critical regime of vapor formation and get smaller at larger T where they even become negligible when reaching the vapor patch stationary state at large time t.
