. 2019 Jun 28;8:e46409. doi: 10.7554/eLife.46409

Figure 1. Measurements of body and limb kinematics in freely-walking Drosophila.

(A) Schematic of experimental setup. Fruit flies walk in a circular arena while illuminated from above and tracked from below using a high-speed camera (150 fps). (B) Data transformations from unstructured video to time series variables. Flies are identified in raw camera frames. Individual fly-frames are then grouped and aligned across sequential camera images. Limb positions relative to the fly’s center of mass are converted into time series variables describing limb movements in the egocentric fly frame. The fly’s limbs are binarized into individual periods of swing (black) and stance (white). (C) Probability density functions (PDFs) of three components of body movement: forward walking velocity (v), lateral walking velocity (v), and rotational velocity (vr). (D) Joint distributions of body velocity components: forward velocity vs. lateral velocity, forward velocity vs. rotational velocity, and lateral velocity vs. rotational velocity. (E) Mean stepping statistics as a function of forward velocity. Step length in the camera frame increases linearly with forward velocity. Swing duration is roughly constant as forward velocity increases when compared to changes in stance duration. Stance duration decreases inversely with increasing forward velocity. τstance~v||-1.025,R2=0.59 (see Materials and methods). For swing events, n = 58,000 to 59,000 for each limb. For stance events, n = 54,000 to 56,000 for each limb.

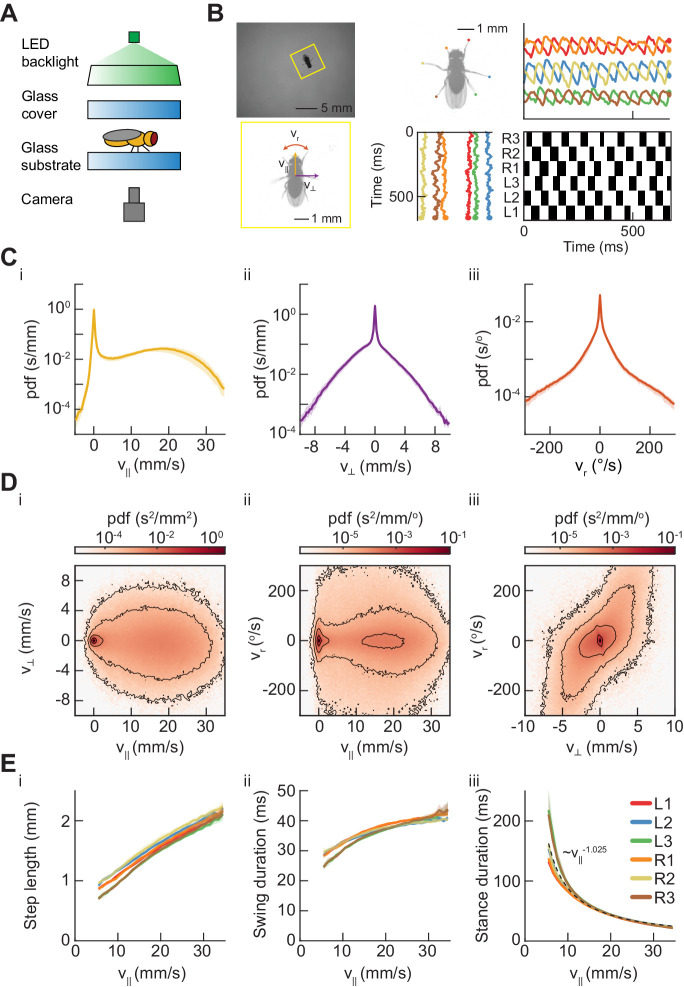
Figure 1.

Figure 1—figure supplement 1. Linear regression accurately identifies footfall positions.

Figure 1—figure supplement 1.

(A) Euclidean error distance (mm) between predicted and actual footfall positions as a function of number of principal components (PCs) included in model, estimated using 10-fold cross-validation. Model used for feature extraction included 1000 PCs. (B) Probability density function (PDF) and cumulative distribution function (CDF) of cross-validated errors (mm) for 1000 PC model used for feature extraction. (C) Learned linear filters that weight oriented fly images (as in Figure 1B) to predict each of the twelve limb positional variables. The spatial extent of each filter is restricted such that correlations between limbs do not bias the resulting predictions (see Materials and methods); this figure shows only the nonzero region of each filter.
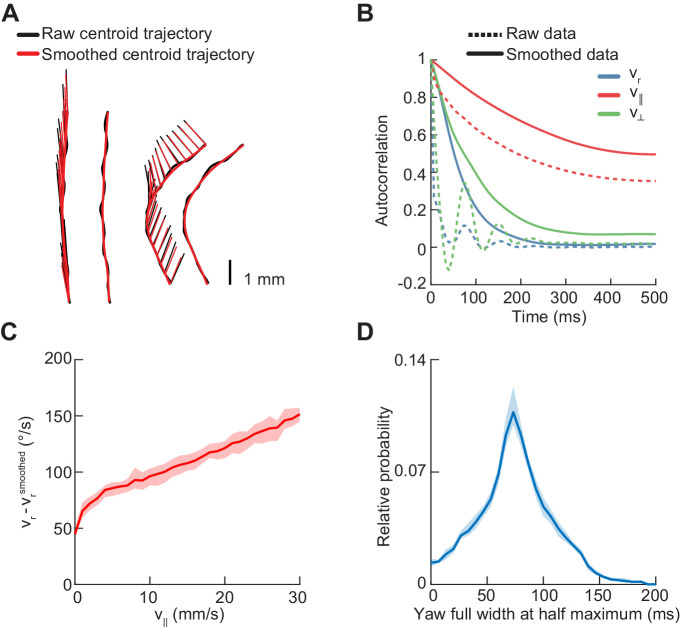
Figure 1—figure supplement 2. Statistics of centroid kinematic behavior in freely-walking flies.

Figure 1—figure supplement 2.

Error patches show 95% confidence intervals obtained from bootstrap distributions over experiments (N = 8 videos; see Materials and methods). (A) Sample centroid trajectories before and after smoothing. The raw path of the centroid is indicated by a thick black line, and the smoothed path by a thick red line. The heading vector is plotted at 20 ms increments as a thin black line before smoothing, and a thin red line after smoothing. (B) Autocorrelation functions of the yaw velocity (blue), forward velocity (red), and lateral velocity (green) of the fly centroid, before (dashed line) and after (solid line) smoothing with a Gaussian kernel with a standard deviation of 20 ms. (C) Mean absolute deviation of unsmoothed yaw velocity from smoothed yaw velocity as a function of forward velocity. (D) Distribution of full widths at half maxima of yaw rate segments centered around extrema.