. 2019 Jun 28;8:e46409. doi: 10.7554/eLife.46409

Figure 4. Dimensionality reduction reveals the manifold structure of limb coordination patterns.

(A) UMAP embedding of limb coordinate time series colored by the mean frequency of forward walking. Frequency (correlated with forward walking velocity) maps to the height along the vase-shaped manifold. (B) Embedding colored by the mean-subtracted positions of the left and right midlimbs. The global phase of the walking behavior defines the location along a cross-section of the manifold. (C) Tripod (green), tetrapod-like (orange), and non-canonical (purple) trajectories from Figure 3F–G embedded in the UMAP space. Start of each trajectory is indicated by a black circle. Arrows indicate the trajectory direction. (D) Embedding colored by number of feet in stance. The number of feet in stance changes with a periodicity of two per cycle at all forward walking speeds.
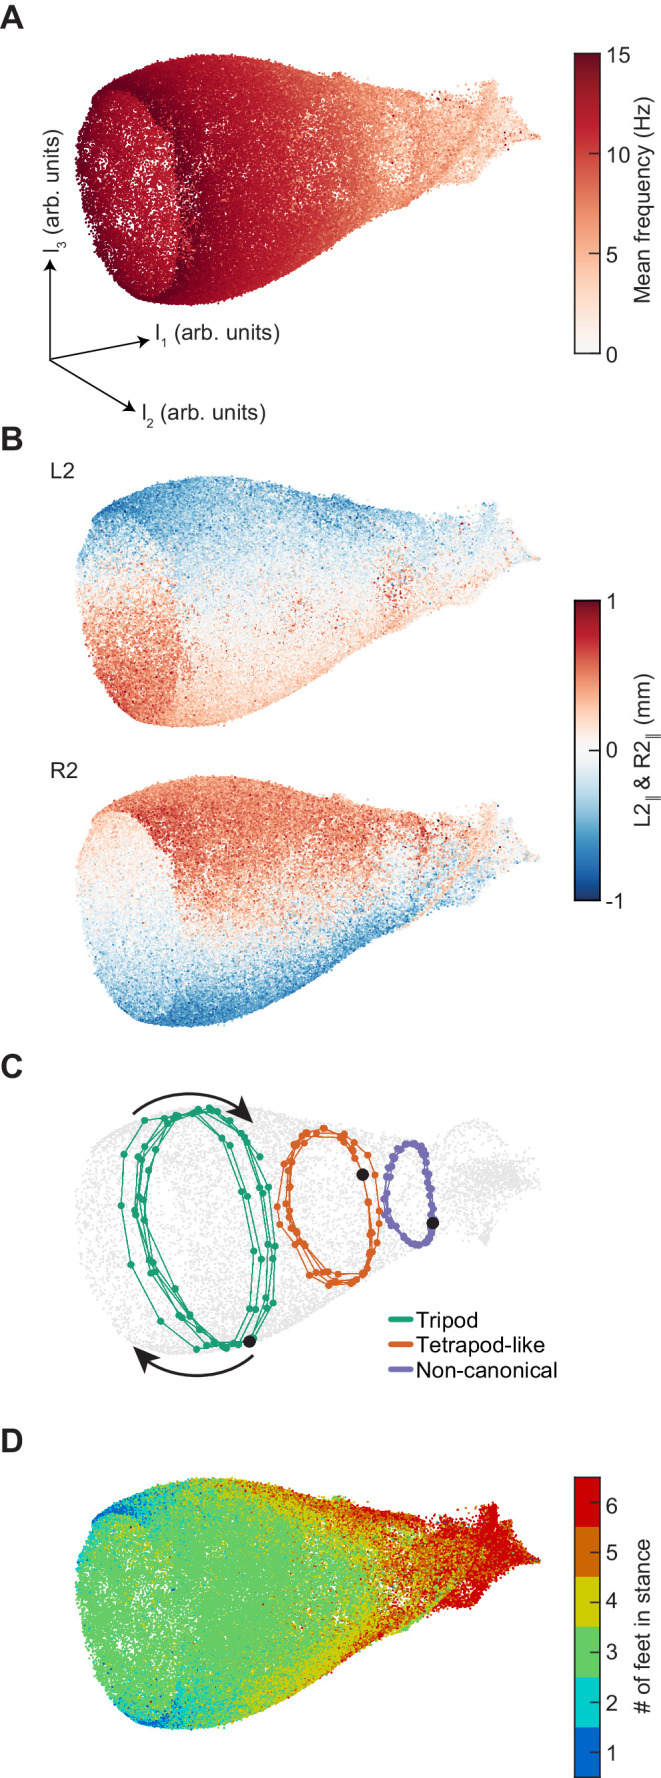
Figure 4.

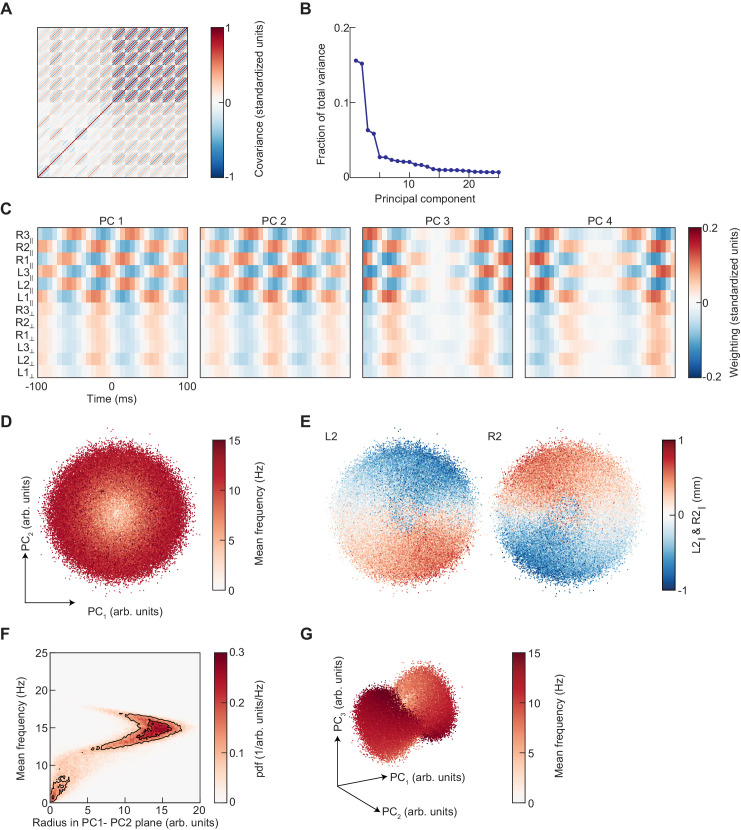
Figure 4—figure supplement 1. Principal component analysis of limb kinematic data.

Figure 4—figure supplement 1.

(A) The covariance matrix of the segments of standardized limb kinematic data used to generate the UMAP embedding in Figure 4. This matrix is approximately a block-symmetric-Toeplitz matrix. (B) The principal component spectrum of these data is composed of degenerate pairs. (C) The first four principal components of the limb kinematic data used to generate the PCA embedding. PC1 and 2 have approximately equal eigenvalues and are approximately phase-shifted versions of one another. PC3 and 4 are also degenerate and approximately phase-shifted. (D) Scatter plot of the projections of limb kinematic data into the first two principal components, colored by the mean frequency of stepping. (E) As in (D), but colored by the mean-subtracted positions of the left and right midlimbs. (F) Joint distribution of radius in the PC1-PC2 plane as shown in (D) and the mean frequency of stepping. The relationship between frequency and radius is multivalued. (G) As in (D), but for the projection into the first three principal components.
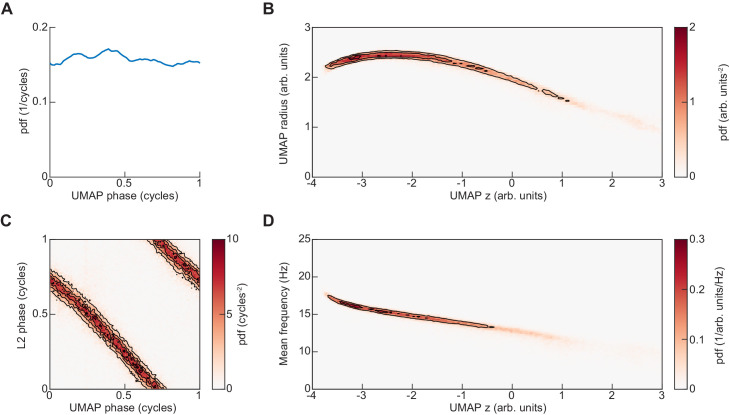
Figure 4—figure supplement 2. Representation of UMAP embedding in cylindrical coordinates.

Figure 4—figure supplement 2.

(A) The UMAP embedding of limb kinematic data shown in Figure 4 was converted into cylindrical coordinates as z=UMAP1, r=UMAP22+UMAP32θ=arctan2UMAP3,UMAP2. Here, the distribution of the resulting UMAP phase angle is shown. (B) Joint distribution of axial and radial coordinates of UMAP embedding. (C) Joint distribution of UMAP phase and L2 instantaneous phase at the central timepoint of the embedded segment. (D) Joint distribution of mean instantaneous frequency and UMAP axial dimension.
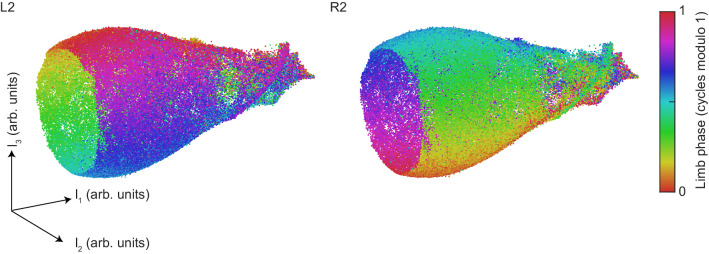
Figure 4—figure supplement 3. Contralateral antiphase is preserved at all phases of the global oscillator.

Figure 4—figure supplement 3.

The UMAP embedding of limb kinematic data shown in Figure 4, colored by the instantaneous phases of the left and right midlimbs at the center point of each segment.
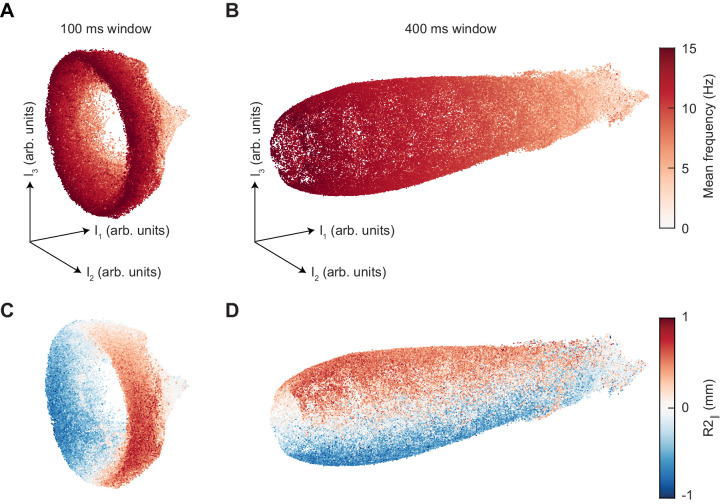
Figure 4—figure supplement 4. Changing the segment duration dilates the axial extent of the UMAP manifold while maintaining the same structure.

Figure 4—figure supplement 4.

(A) UMAP embedding of 100 ms segments of limb positional data, colored by mean stepping frequency (see Figure 4A). (B) As in (A), but for 400 ms segments. (C) As in (A), but colored by the position of the right midlimb in the direction parallel to the body axis (see Figure 4B). (D) As in (C), but for 400 ms segments.
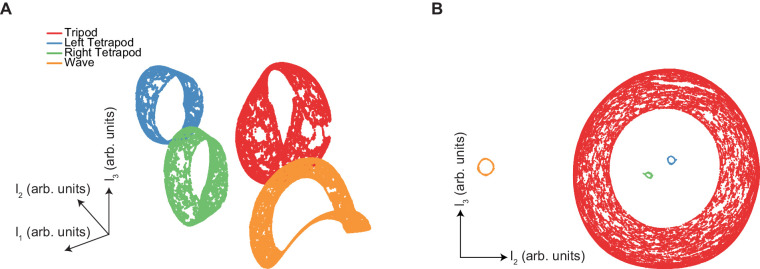
Figure 4—figure supplement 5. The manifold structure of synthetic canonical gaits differs qualitatively from that of free-walking Drosophila.

Figure 4—figure supplement 5.

(A) UMAP embedding (see Materials and methods) of synthetic tripod (red), left tetrapod (blue), right tetrapod (green), and wave gaits (orange) reveals separate manifolds for each canonical gait type. Tripod, tetrapod, and wave gaits occur with equal abundance in this embedding. (B) Separation of UMAP manifolds remains even with low abundance of non-tripod gaits. Gaits represented different fractions of the input data: tripod (red) 98%, left tetrapod (blue) 0.5%, right tetrapod (green) 0.5%, wave gait (orange) 1%.