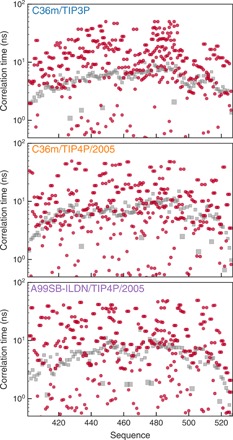
Fig. 4. Comparison of intrasegment dynamics and longest relaxation active time scale.

Time scales associated with intrasegment dynamics at 298 K (red circles) in C3P (top), C4P (middle), and A4P (bottom) are compared with the longest time scale resulting from fitting segmental dynamics correlation functions (gray squares, see also fig. S7).
