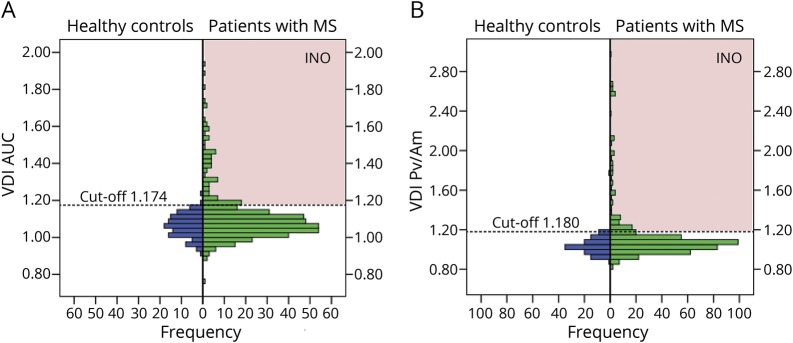
Figure 2. VDI distribution.
Distribution of the VDI AUC and Pv/Am of 15° saccades of healthy controls and patients with MS. Both leftward and rightward VDIs are included. The INO detection thresholds are indicated by the dashed lines. Patients with MS who had VDIs above one of these thresholds (red-shaded areas) are classified as INO. (A) VDI AUC, detection threshold 1.174. (B) VDI Pv/Am, detection threshold 1.180. AUC = area under the curve; INO = internuclear ophthalmoplegia; MS = multiple sclerosis; Pv/Am = peak velocity divided by amplitude; VDI = versional dysconjugacy index.

