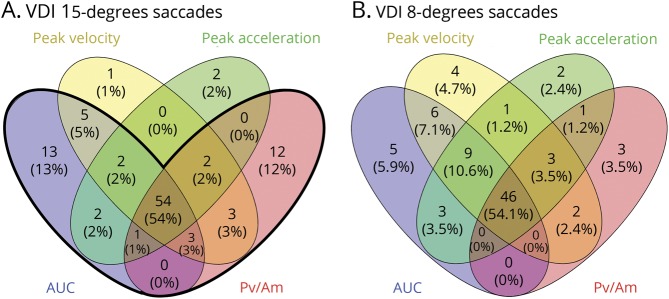
Figure 3. VDI parameter comparisons.
Venn diagram showing the (overlap between) the detection of internuclear ophthalmoplegias with different VDI parameters. For every parameter, the number and percentage of VDIs in the multiple sclerosis group that exceeded the VDI cutoffs at a specificity level of 98% (table 2) are presented. Both leftward and rightward VDIs are included. (A) VDIs of 15° saccades. Total number of VDIs above the thresholds: 100. The bold black line indicates the combined detection of the VDI AUC and VDI Pv/Am of 15° saccades, which resulted in the highest accuracy. With this detection, 97% of the number of VDIs above the threshold is included, which corresponds to 23% of all VDIs of patients with multiple sclerosis included in the analysis. The corresponding specificity (percentage of VDIs of healthy controls that do not exceed the threshold) is 97%. (B) VDIs of 8° saccades. Total number of VDs above the thresholds is 85. AUC = area under the curve of saccadic trajectory; Pv/Am = peak velocity divided by amplitude; VDI = versional dysconjugacy index.

