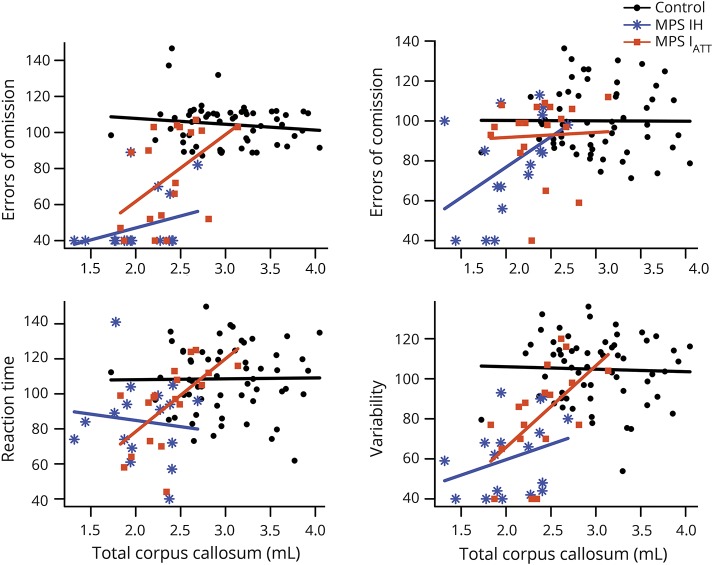
Figure 4. Association between attention scores and CC volumes.
Each graph depicts a separate attention domain. Attention score (y-axis) is a standard score with a population mean of 100 and SD of 15. Associated corpus callosum (CC) volume is in milliliters (x-axis). These are plotted for each participant along with a regression line for each group as a whole (Hurler syndrome form of mucopolysaccharidosis type I [MPS IH], attenuated form of mucopolysaccharidosis type I [MPS IATT], and controls).

