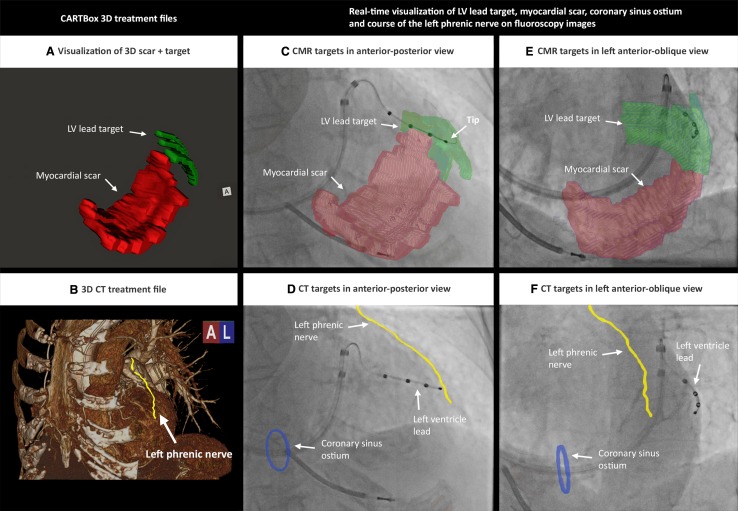
Fig. 4.
Real-time visualization of CMR and CT targets. a, b 3D-treatment file of CMR data (a) and CT data (b). c–f After 3D image fusion of the 3D-treatment dataset with fluoroscopy, the LV lead targets and scar segments (c, e) together with left phrenic nerve and coronary ostium (d, f) are visualized on live fluoroscopy during the LV lead implantation. CMR cardiac magnetic resonance, CT computed tomography

