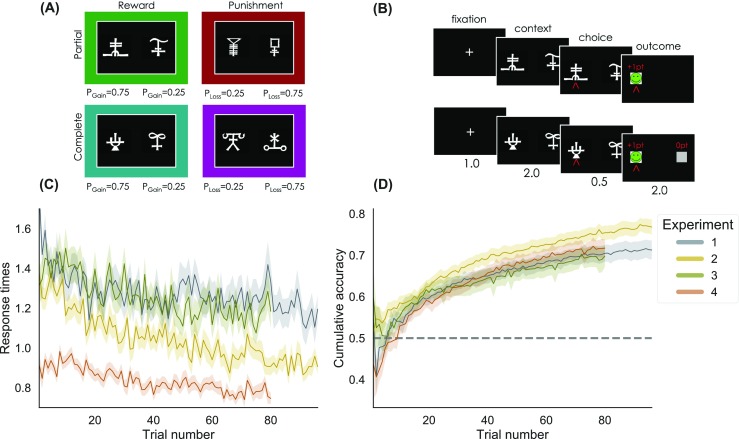
Fig. 1.

Task factors and learning curves. a The learning task 2×2 factorial design. Different symbols were used as cues in each context, and symbol to context attribution was randomized across participants. The colored frames are purely illustrative and represent each of the four context conditions throughout all figures. “Reward”: gain domain; “Punishment”: loss domain; “Partial”: only feedback of the chosen option is provided; “Complete”: both feedback of chosen and unchosen options are provided; PGain= probability of gaining 1 point; PLoss= probability of losing 1 point. b Time course of example trials in the reward-partial (top) and reward-complete (bottom) conditions. Stimuli durations are given in seconds. c Average response times during learning. d Cumulative accuracy during learning. Shaded areas in c and d represent the 95% Bayesian credible intervals. The horizontal dotted line in d indicates chance level
