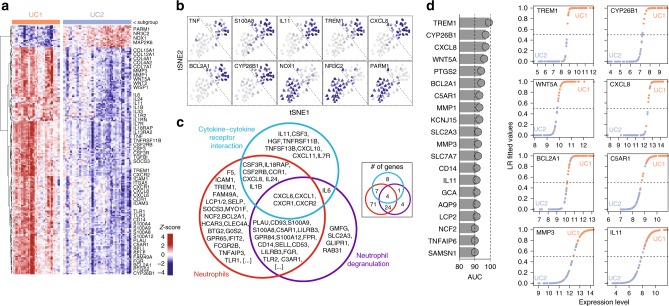
Fig. 4.
UC1 transcriptomic profile is enriched for the inflammatory signature. a Heatmap of DEGs between UC1 and UC2 patients, including all genes in the human data set. Only the selected genes are shown, grouped by functional categories and respective to the expression level. b t-SNE overlay of the expression level of selected DEGs between UC1 and UC2, showing inter-patient variation. c Venn diagram of the top GO, KEGG, and cell-enriched terms identified from the DEGs between UC1 and UC2. d Top 20 genes ranked by area under the curve (AUC) for specificity and sensitivity to distinguish UC1 from UC2, among the list of DEGs (left). Classification was carried out using logistic regression. The fitted values of prediction are shown for selected genes (right)

