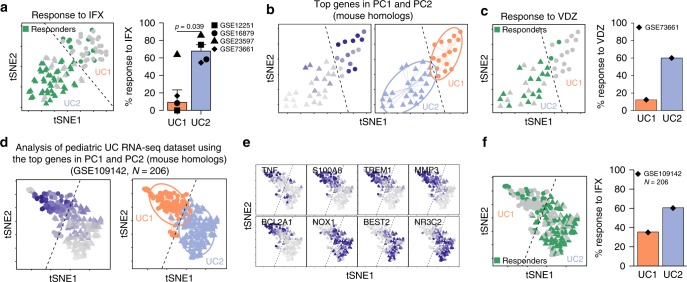
Fig. 5.
UC1 and UC2 differ on their response to IFX and VDZ therapy. a Individual patient response to IFX therapy in each group and the percentage of patients responding to IFX in each cohort. b t-SNE plot using the top variable genes identified from the mouse data set. Average expression of mouse homolog genes used to subdivide patients (left), where dark blue color indicates a higher average expression. Unsupervised hierarchical agglomerative clustering was used to automatically define patient subdivision (right). Dashed line delimits UC1 (triangle) and UC2 (circles) patients. c Individual patient response to VDZ therapy in each group and the percentage of patients responding to VDZ in the cohort (right). d t-SNE for data set GSE109 containing 206 pediatric UC patients plot, using the top variable genes identified from the mouse data set. Each point represents a patient sample. The average expression of mouse homolog genes used (left) to subdivide patients into UC1 or UC2 (right). Unsupervised hierarchical agglomerative clustering was used to automatically define patient subdivision (right). Dashed line delimits UC1 (triangle) and UC2 (circles) patients. e t-SNE overlay of the expression level of selected DEGs between UC1 and UC2, showing inter-patient variation in the pediatric UC cohort. f Individual patient response to IFX therapy in each group and the percentage of patients responding to IFX in each cohort

