Figure 1.
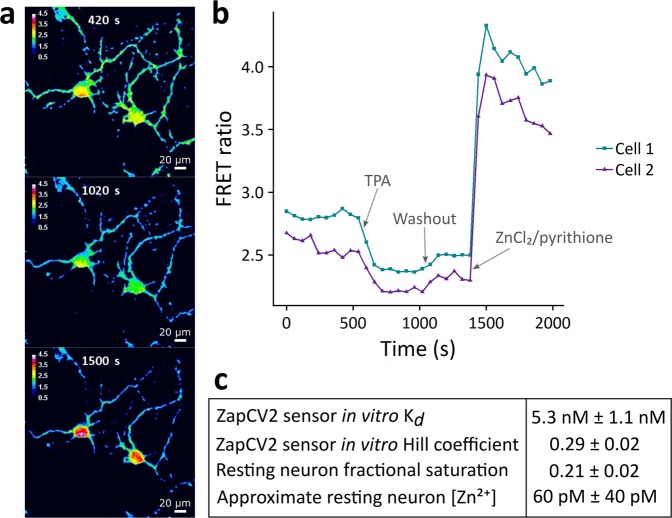
Genetically encoded Zn2+ FRET sensor measurements in resting neurons. (a) Images displaying the FRET ratio (FRET channel intensity/CFP channel intensity) of relevant neuronal areas within a field of view. Cells and times correspond to the traces in part (b) and picture resting (top), minimal (middle), and maximal (bottom) ratios obtained during a calibration. (b) Sample traces from a typical FRET sensor calibration. Each trace is derived from a region of interest in two separate cells within one field of view. Resting FRET ratios were observed, followed by treatment with 10 µM TPA and subsequently 10 µM ZnCl2/2.5 µM pyrithione to determine minimum and maximum FRET ratios, respectively. (c) Quantification of Zn2+ based on the in vitro binding parameters of the sensor. Errors correspond to standard error of the mean. n = 14 cells from 6 separate biological replicates derived from 2 separate cell preparations.

