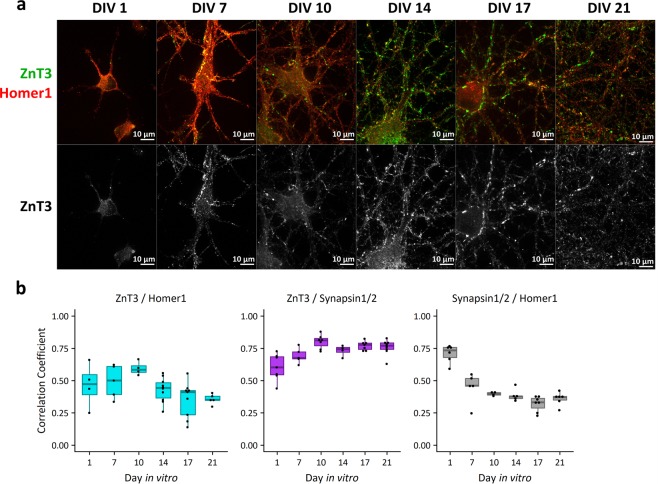
Figure 2.
Expression and localization of Zn2+ transporter ZnT3 in cultured neurons by immunofluorescence. (a) ZnT3 (synaptic vesicle Zn2+ transporter, pseudocolored green or displayed in grayscale below) and Homer1 (post-synaptic density protein, pseudocolored red) are stained at different timepoints in culture. ZnT3 increases in expression over time in culture, and shows synaptic localization starting at DIV 10. Channel intensities of all images are scaled identically. (b) 2D correlation coefficients calculated on raw immunofluorescence images. Smaller correlation coefficients are more likely to represent less colocalization. ZnT3 maintains a high correlation coefficient compared to Synapsin1/2 across the time course, whereas Synapsin1/2 compared to Homer1 and ZnT3 compared to Homer1 decrease over time. Each DIV/protein comparison is one biological replicate, with each dot representing a separate field of view within the sample.

