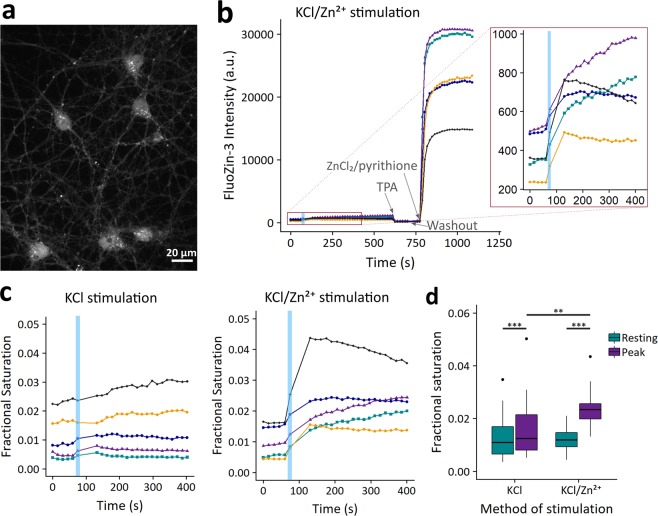
Figure 4.
Intracellular Zn2+ signal in stimulated neurons. (a) Image of neurons treated with FluoZin-3 AM after stimulation with KCl in the presence of 10 µM ZnCl2. (b) Sample traces from a typical stimulation experiment. Each trace is derived from a region of interest within a different cell. 50 mM KCl stimulation was applied for 10 seconds (blue box) along with 10 µM ZnCl2, followed by a washout period and further imaging. Samples were calibrated by addition of 10 µM Zn2+ chelator TPA and then 10 µM ZnCl2/2.5 µM pyrithione in order to determine minimal and maximal signal for calculation of fractional saturation. Inset shows greater resolution for the time period around stimulation. Fluorescence intensity is background-corrected. (c) Sample traces from typical experiments described in (b), displayed as the calculated fractional saturation. Representative traces are shown for samples treated with KCl in the absence (left) or presence (right) of 10 μM extracellular ZnCl2. For clarity, only the first 400 seconds are shown. (d) Box plot of FluoZin-3 fractional saturation levels at rest and at peak level after KCl stimulation with or without 10 µM extracellular ZnCl2. n = 32 cells in 3 separate biological replicates for KCl stimulation alone and n = 18 cells in 3 separate biological replicates for the KCl/Zn2+ condition. Dots correspond to outliers, defined as points lying over (3rd quartile + 1.5 × (interquartile range)). ***p < 0.001 or **p < 0.01 as assessed with a two-sided Wilcox Signed Rank test for paired data within conditions (KCl: test statistic V = 0, p = 4.6e-10; KCl/Zn2+: test statistic V = 0, p = 7.6e-09) and a two-sided Mann-Whitney U unpaired test between the KCl and KCl/Zn2+ resting and peak conditions (test statistic W = 131, p = 0.0012). No significant difference between resting conditions was observed (test statistic W = 276, p = 0.818).

