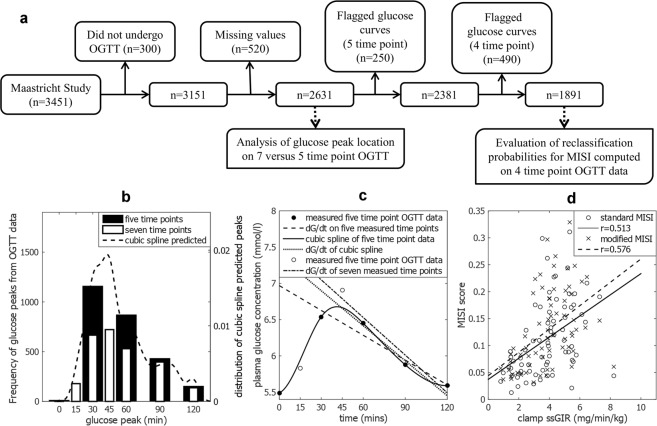
Figure 1.
Overview of exclusion criteria for Maastricht Study data and results of analysis in PRESERVE and Maastricht studies. (a) Flow chart of exclusion of data from the Maastricht Study for analysis. (b) Bar plots of time of glucose peak in Maastricht study OGTT data, white bars show seven time point data; black bars indicate the five time point subset. Dashed line shows distribution of peak glucose time predicted by cubic splining of five time point data. (c) dG/dt five (dashed line) computed on a five time point subset (black circles) differs from dG/dt seven (dot-dashed line) computed on a seven time point OGTT (black circles plus empty circles). dG/dt spline (dotted line) computed on a cubic spline of the five time point data (solid line) more closely represents the seven time point dG/dt. (d) Scatter plot of PRESERVE Study (n = 69) clamp ssGIR with both the standard MISI (open circles) and cubic spline MISI (crosses). Correlation for standard MISI and modified MISI with ssGIR value are represented by the solid and dashed lines of best fit respectively.

