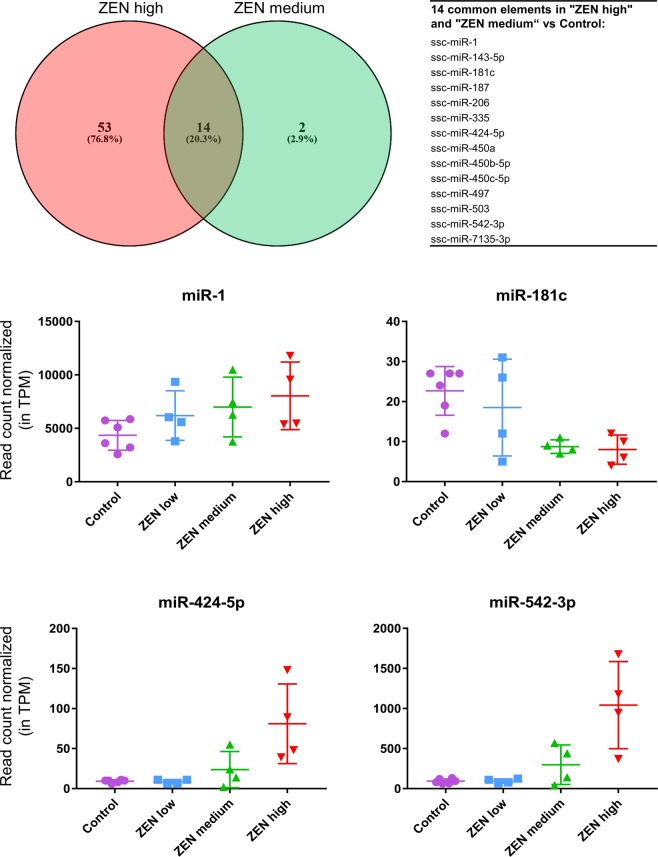
Figure 3.
Effect of increasing dietary ZEN concentration on microRNA expression in the uterus. The Venn diagram (top) lists the 14 microRNAs commonly affected in the ZEN medium and ZEN high groups, and significantly different from the control group. As an example, the normalized read counts (tags per million, TPM) of miR-1, miR-181c, miR-424-5p, and miR-542-3p in the Control (n = 6) and ZEN exposed groups (n = 4 per group) are displayed.

