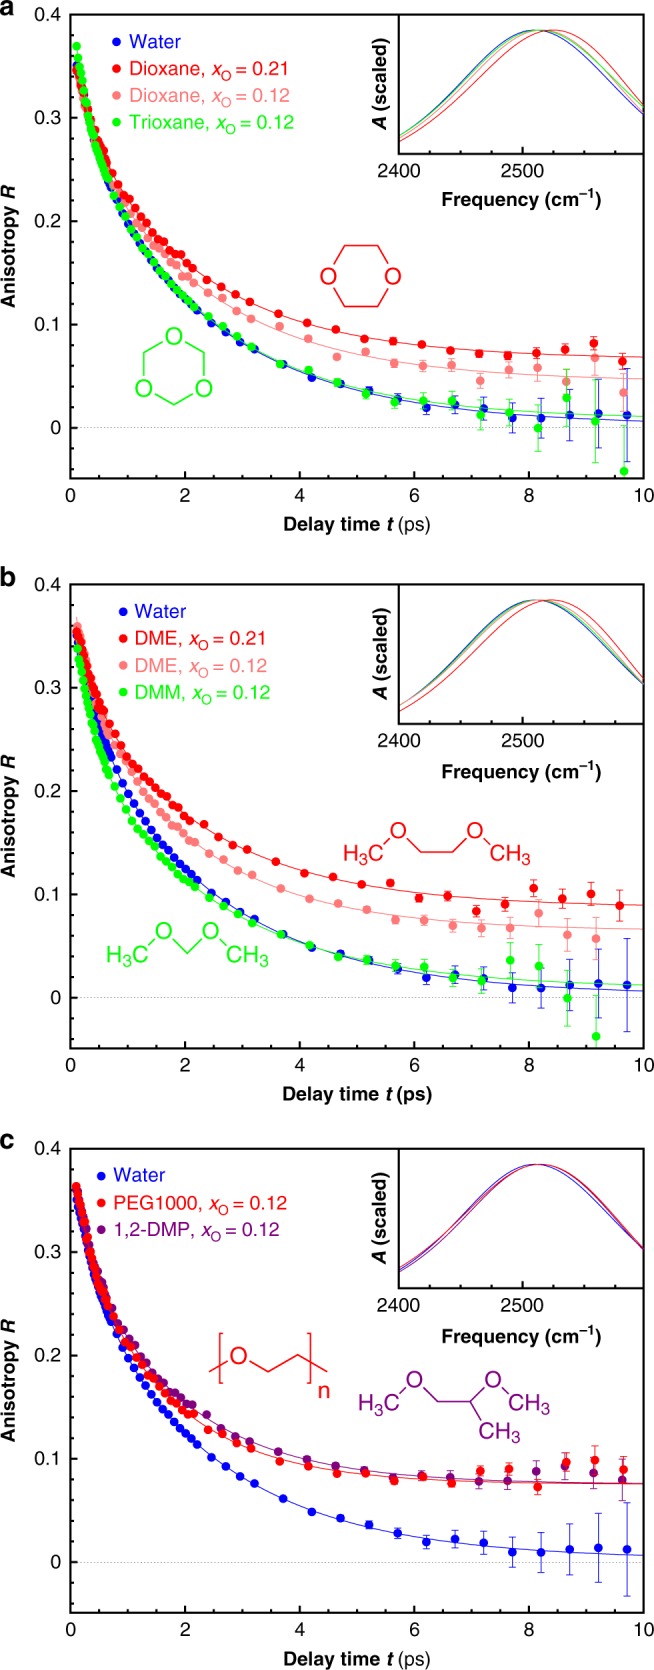
Fig. 2.

OD-Stretch anisotropy decay of different polyether solutions. The solutions are in isotopically diluted water (6% HDO:H2O). The legend indicates the molar fraction xO of ether O atoms with respect to the total number of molecules in the solution. The curves are least-squares fits (see Supplementary Table 1 for the fit parameters and Supplementary Note 1 for the details of the fit procedure). a Cyclic PEG and POM oligomers; b the building blocks of PEG and POM; c PEG-1000 and 1,2-dimethoxypropane. In each plot, the inset shows the IR absorption spectra of the solutions. The error bars represent 1σ
