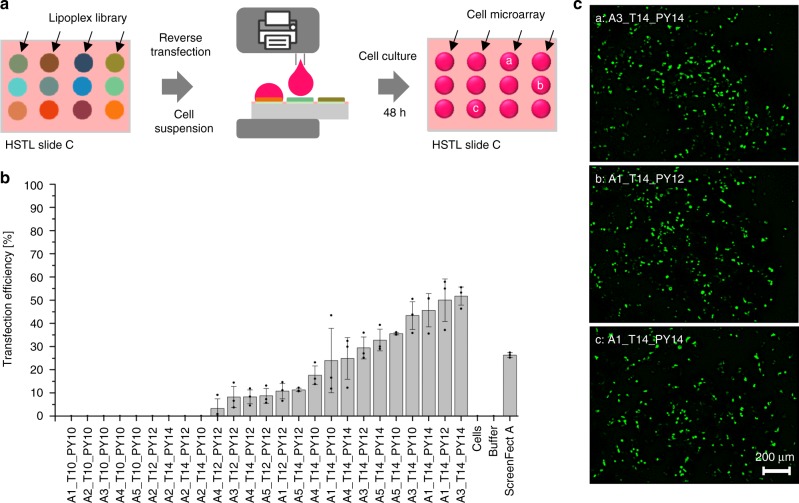
Fig. 6.
On-chip reversed cell transfection screening of the produced lipoplex library. a Schematic showing the process of on-chip cell transfection screening. Five microliter of HEK293T cell suspensions were printed into each hydrophilic spot on the HSTL slide C covered by the dried lipoplex cell transfection mixture. After incubating the array for 48 h at 36 °C and 5% CO2, 1 µL of staining solution was printed into each droplet, followed by 15 min incubation and fluorescence microscopy analysis. b Bar chart visualizing mean values of transfection efficiencies (number of GFP-transfected cells per total cell number) calculated based on three independent experiments (overlaid dot plots) covering the entire pipeline including on-chip library synthesis, formation of lipoplexes and cell transfection. A3_T14_PY14 lipidoid proved to be most efficient in our study, resulting in 52 ± 4% transfection efficiency. Error bars are standard deviations, n = 3 (number of replicates); N = 3 (repetitions including lipid synthesis). Source data are provided as a Source Data file. c Fluorescence microscopy images of pCS2-GFP transfected cells. Scale bar: 200 μm

