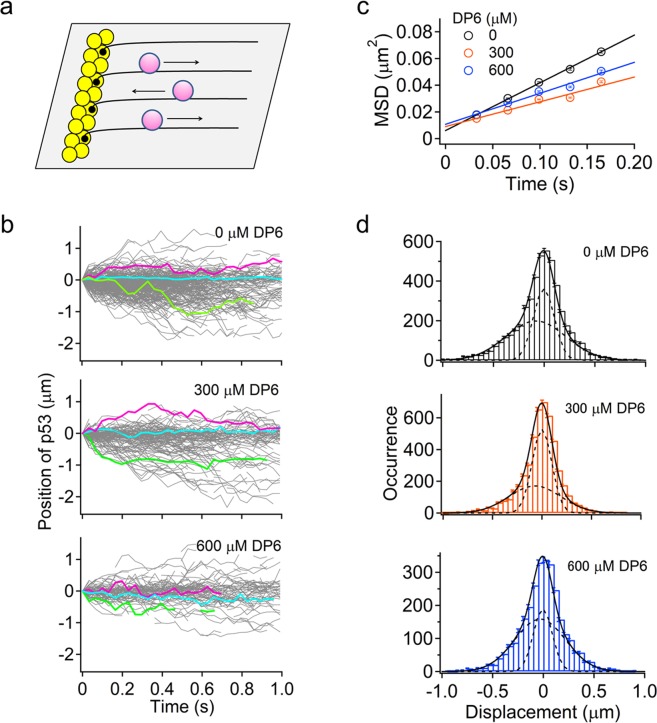
Figure 4.
Effect of the designed peptide DP6 on 1D sliding of the p53 tetramer along DNA. (a) Schematic diagram of the single-molecule detection of p53 labeled with Atto532 on a DNA array. Yellow circles, pink circles, and solid lines represent NeutrAvidin, p53, and DNA, respectively. (b) Typical single-molecule trajectories of FL-p53 along nonspecific DNA at various DP6 concentrations. Several traces are colored for clarity. (c) Time courses of the averaged MSD of FL-p53 at various DP6 concentrations. (d) Displacement distributions for the sliding dynamics of FL-p53 at various DP6 concentrations. Bars represent the displacement distributions observed at time intervals of 165 ms. Errors of the bar were estimated by a bootstrap method with 1,000 iterations. Solid and dashed curves are best-fitted curves obtained using Equation (3) described in Methods and the distributions of each mode, respectively.

