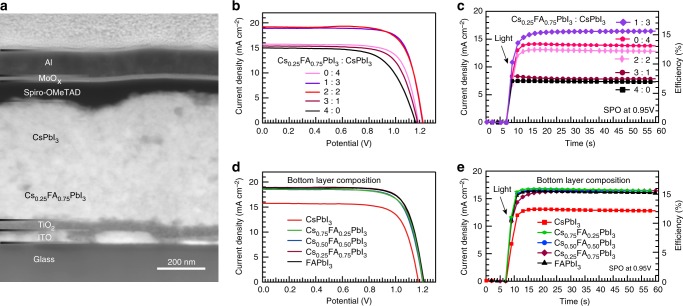
Fig. 3.
Photovoltaic performance of solar cells. a Cross-sectional STEM-HAADF image of devices with the structure of Glass/ITO/TiO2/Cs0.25FA0.75PbI3/CsPbI3/spiro-OMeTAD/MoOx/Al. b, c J–V curves recorded by reverse scans (from open circuit to short circuit) and SPO at 0.95 V of devices with different thickness ratio of Cs0.25FA0.75PbI3 layer to CsPbI3 layer in the perovskite QD absorber, respectively. d, e J–V curves measured via reverse scans and SPO at 0.95 V of devices with different compositions of the bottom layer in the perovskite QD absorber where the heterojunction position is constant

