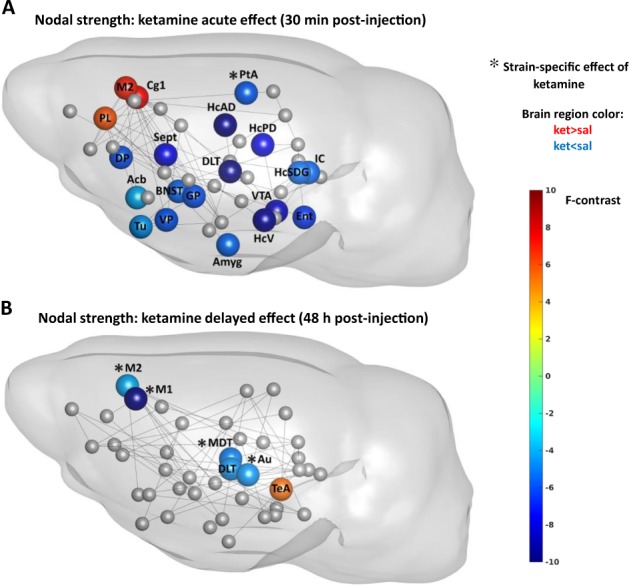
Fig. 3. The acute (a) and delayed (b) effects of ketamine on nodal strength in the NC and PC groups.

Here we show only the statistically significant effects of treatment (nodes without asterisk) and interaction of group and treatment (nodes with asterisk) on nodal strength from two-way ANOVA test. The effect of treatment (ketamine) had same direction in the NC and PC rats, whereas the effect of interaction of group and treatment had an opposite direction (for those cases we illustrate the direction in the NC group). Sphere color represents the F-statistic values from two-way ANOVA test for effects of treatment and interaction. The presence of connections (lines) between brain regions illustrate whether there was a change in inter-nodal correlation coefficients after ketamine in the NC rats versus saline condition. See legend of Fig. 2 for the abbreviations of brain regions
