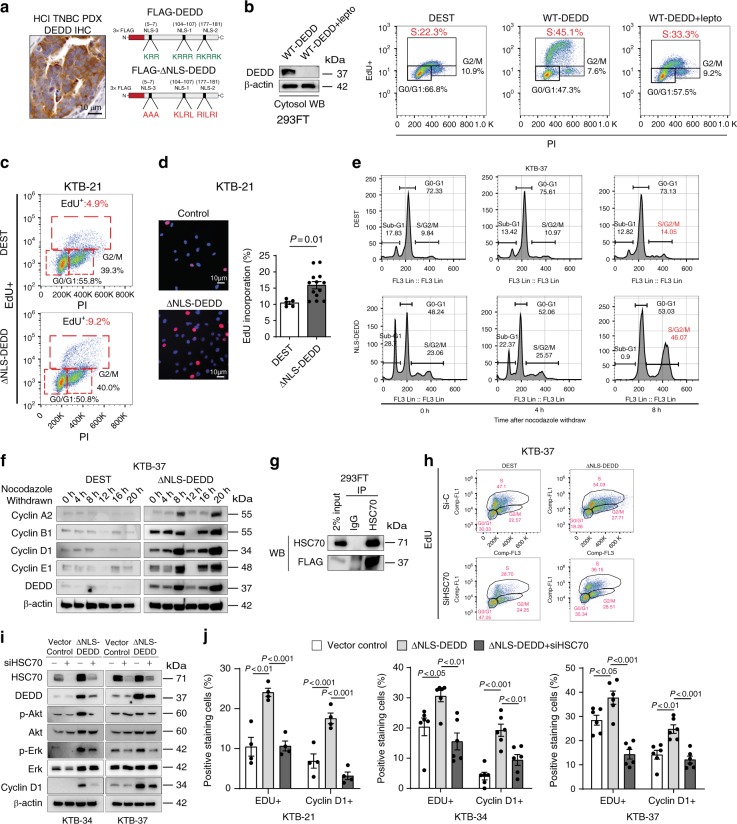
Fig. 3.
Death effector domain-containing DNA-binding protein (DEDD) mediates heat-shock cognate 71 kDa protein (HSC70)-dependent G1/S progression and cyclin D1. a, Left: immunohistochemistry (IHC) staining of DEDD in triple-negative breast cancer (TNBC) patient-derived xenograft (PDX) tissue. Right: Schematic of 3×-FLAG-tagged wild-type DEDD nuclear localization sequence (NLS) location and its mutated form. b, Left: Western blot showing FLAG-DEDD expression in 293FT cells with or without cytosol shuttle inhibitor leptomycin treatment (10 μg/mL, 3 h). Right: Representative flow cytometry biaxial plots of 293FT cells showing 5-ethynyl-2′-deoxyuridine (EdU) incorporation with or without expression of wild-type DEDD or cytosolic DEDD (∆NLS-DEDD). c Representative flow cytometry biaxial plots of KTB-21 cells showing EdU incorporation with or without expression of cytosolic DEDD (ΔNLS-DEDD). DEST: control vector. d, Left: Representative immunofluorescence staining showing EdU incorporation of KTB cells with or without expression of cytosolic DEDD. 4′,6-Diamidino-2-phenylindole (DAPI): Blue; Red: EdU. Right: Quantification of EdU incorporation assay. e Representative flow cytometry biaxial plots of KTB-37 cells showing EdU incorporation with or without the expression of cytosolic DEDD after cell cycle release from nocodazole treatment (100 ng/mL) for 24 h. f Immunoblots showing cyclin profiles as well as DEDD expression of control plasmid or ∆NLS-DEDD-overexpressed normal mammary epithelial cells (KTB-37) at different time points after cells withdrawn from nocodazole treatment (100 ng/mL). g Immunoprecipitation assay showing the interaction between cytosolic DEDD and heat- shock cognate 71 kDa protein (HSC70) after overexpressing 3×-FLAG-DEL-NLS-DEDD plasmid in 293FT cells. h Representative flow cytometry biaxial plots showing EdU incorporation of HSC70-knockdown KTB-37 cells with or without the expression of cytosolic DEDD. i Western blots showing cell signaling changes of KTB cell lines with or without the treatment of HSC70 small interfering RNAs (siRNAs) for 2 days. j Bar chart showing the percentage of the immunofluorescence staining positive cells expressing either cytosolic DEDD or control vector in KTB cell lines with/without the treatment of HSC70 siRNAs for 2 days. Blue: DAPI; Red: EdU+. All quantitative data were generated from a minimum of three replicates. P values were derived from one-way analysis of variance (ANOVA) with multiple comparison test. Error bars represent means ± s.e.m.

