Fig. 2.

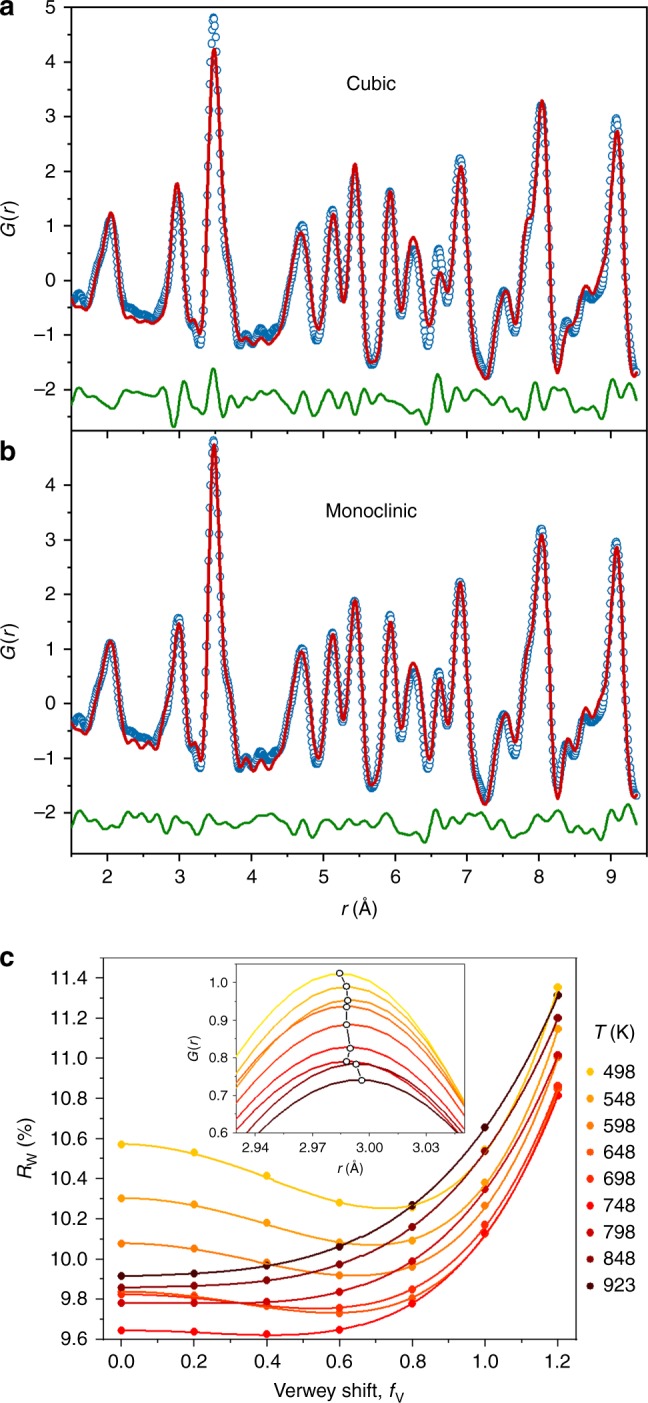
Fitting of magnetite pair distribution functions (PDFs). a, b Comparison of fits of a the cubic (residual Rw = 15.6%) and b the monoclinic superstructure (Rw = 11.6%) models to the 90 K PDF. The visible improvement of the fit to the r ≈ 3 Å peak measuring nearest neighbour Fe–Fe (and O–O) distances and lowering of Rw demonstrates sensitivity to the monoclinic Verwey superstructure distortions. PDF data are open blue circles, fits are red curves and the difference is below in green. c Rw as a function of the Verwey shift parameter fV from fits to the First Unit Cell region of the high-temperature PDFs. The well-defined minimum seen at fV ≈ 0.8 for the 498 K fits becomes more shallow and moves to zero at the highest temperatures, as plotted in Fig. 3b. This subtle change of local structure can be seen in the shift in the maximum of the 3 Å peak to slightly longer r (inset), consistent with the loss of Fe–Fe distances shortened through trimeron bonding
