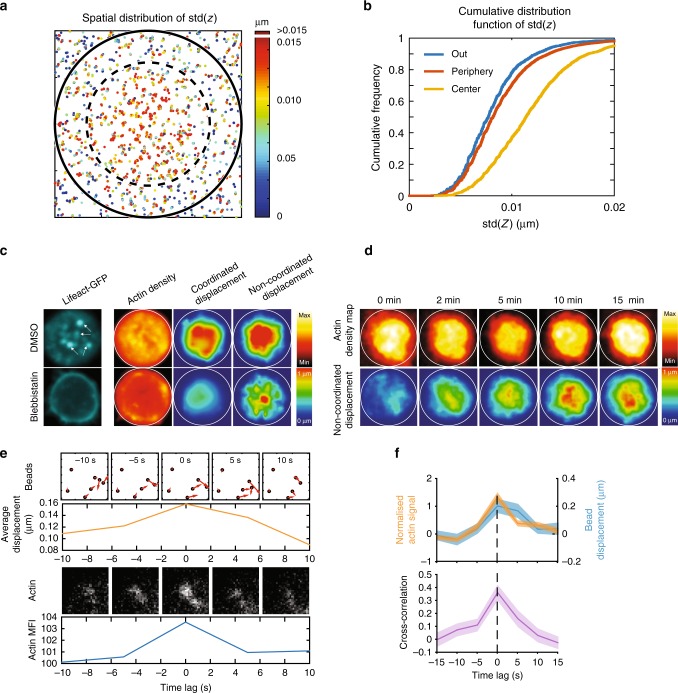
Fig. 5.
Actin dynamics at the synapse. a Space distribution of bead displacement in the z direction: each point represents the standard deviation of the z position of a single bead on a 10 frame sequence; all beads have been projected on a size and aspect ratio normalized cell (inner circle at 2/3 of the cell diameter) represents the central portion of the synapse: the figure show that the displacement in z is higher in the center of the synapse (8422 points, superposition of 14 cells, one representative experiment). b Cumulative distribution for the z displacement color-coded in figure a, the central fraction of beads shows significantly higher displacement in z (P < 0.0001 for all comparison, Kolmogorov–Smirnov test). c Left, single cell showing actin patches in the center of the cell which are lost in case of para-Nitroblebbistatin treated cells. Right, mean actin distribution, mean coordinated and mean non-coordinated force density color map in control and para-Nitroblebbistatin treated B cells (n = 12). d Actin distribution over time correlates with non-coordinated force distribution (images are average projection of 12 cells over all time points). e Time-lapse images showing simultaneous appearance of an actin patch and non-coordinated bead displacements, arrowhead showing direction and magnitude of displacement; graphs below the images represent the respective signals integrated over a square of 2 µm × 2 µm. f Average of the signals quantified in e and average cross-correlation: both signals appear simultaneously and show a peak simultaneously with no lag (mean ± SEM, n = 89, from nine cells, two independent experiments). Source data are provided as a Source Data file

