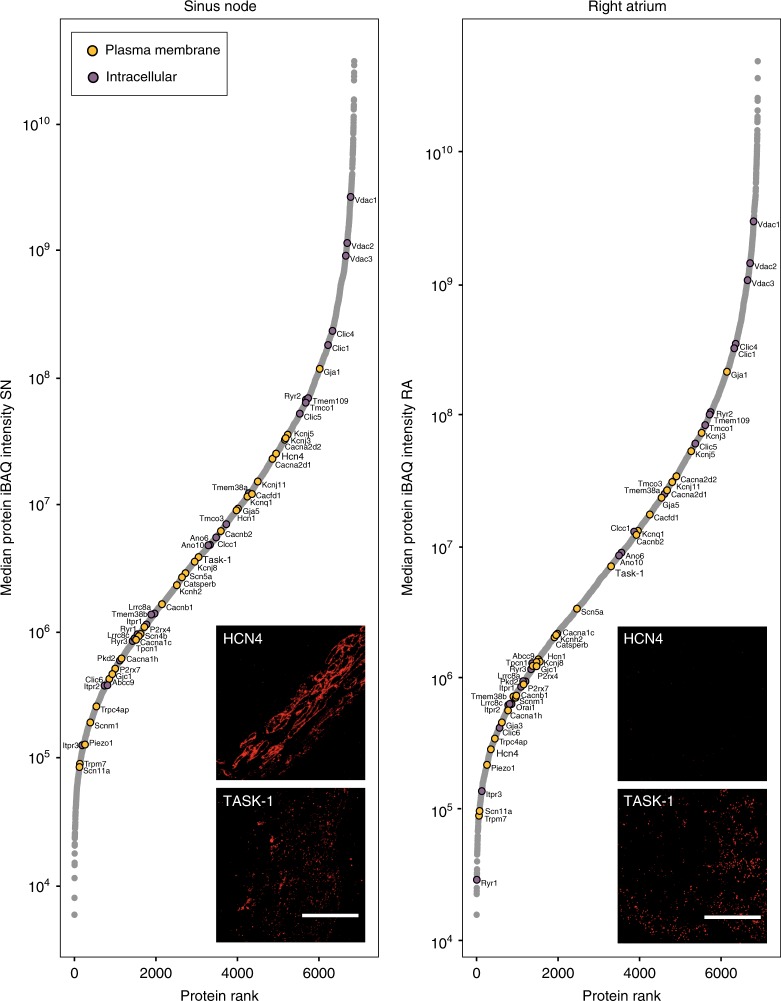
Fig. 4.
Abundance of ion channels in sinus node and atrial muscle. Rank plots show proteins ranked from lowest to highest protein intensity (y-axis) for sinus node (SN, left) and atrial muscle (RA, right). Ion channels of interest are highlighted and classified by major subcellular localisation (plasma membrane or intracellular). Image insets show immunolabeling of Hcn4 or TASK-1 in tissue sections from sinus node (left) or atrial muscle (right), respectively. iBAQ, intensity-based absolute quantification. Scale bars denote 50 µm. Mean protein intensity values are based on three biological replicates in each group, each containing pooled tissue sections from ten mice. Source Data is provided in Supplementary Data 3

