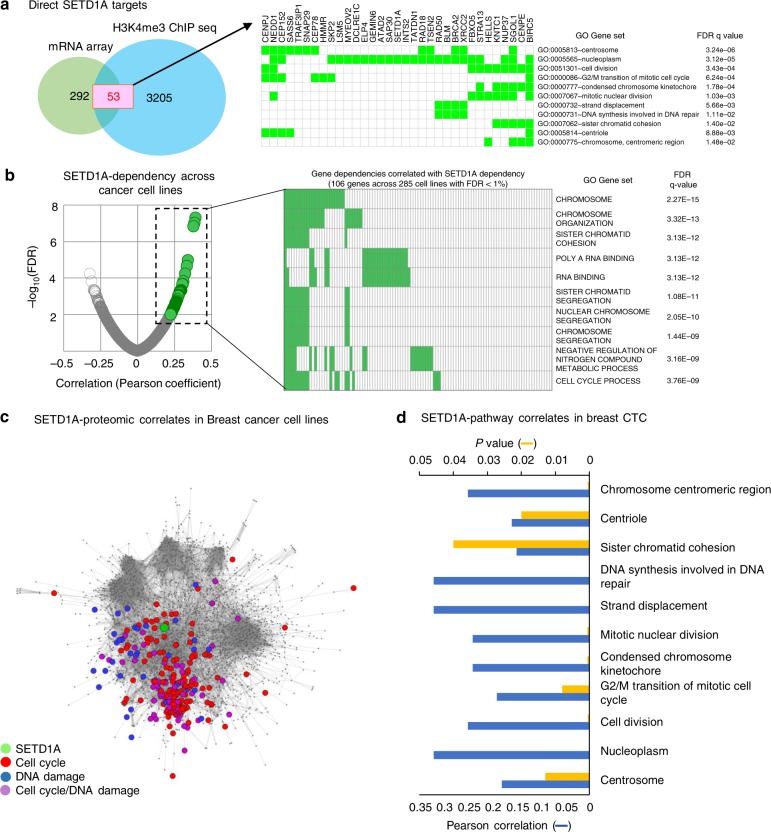
Fig. 3.
SETD1A regulates mitosis, cell cycle and DNA damage response genes. a Left: Transcriptome analysis of SETD1-KD A549 and MDA-MB-231 cells identified 345 genes suppressed across both cell lines (Supplementary Fig. 3a). shGFP-cells were used as control. Comparison of these 345 genes against 3258 H3K4 methylation marks suppressed in SETD1A-KD cells identified 53 direct SETD1A targets (Supplementary Fig. 3a). Right: The 53 SETD1A targets are enriched for targets involved in mitosis, cell cycle regulation and DNA damage response. Genes contributing to the enrichment of each pathway and FDR q-values are shown. b SETD1A-dependent cancer cells are sensitive to inactivation of genes involved in cell cycle and mitosis Left: 17,079 gene dependencies were ranked by correlation with SETD1A dependence across 285 cancer lines, as measured by Project Achilles (DEMETER v2.20.2 gene scores). Pearson coefficient vs. -log FDR is plotted for each gene (gray), and significant direct correlates are highlighted (green, FDR < 1%). Right: GSEA on the 106 gene dependencies best correlated with SETD1A dependence (black square in Fig. 2b on the left). Top 10 most significant overlaps, accounting for 57% of genes analyzed, are shown. 7/10 GO gene sets are associated with sister chromatid cohesion. c Analysis of high-throughput quantitative proteome data from 41 breast cancer lines shows that endogenous baseline SETD1A protein expression correlates with pathways involving mitosis, cell cycle and DNA damage responses. Cytoscape network map depicting proteins enriched by greater than log2(0.5) by quantitative MS (GSEA FDR ≤ 0.25; Nominal p value cutoff < 0.05). The heatmap displaying the hierarchical clustering of leading-edge proteins related to the processes indicated are shown in Supplementary Fig. 3d. The full set of gene enrichment results are provided in Supplementary table 1. d SETD1A expression in CTCs from metastatic breast cancer patients correlates with the expression of SETD1A-targets involved in cell cycle, mitosis and DNA damage responses. Graph shows the Pearson correlation coefficient between the leading edge-genes identified for each of the gene signatures shown in (a) and SETD1A expression in RNASeq data from single CTCs derived from breast cancer patients29,30. The p values for each pathway is provided. Source data are provided as a Source Data file

