Fig. 4.
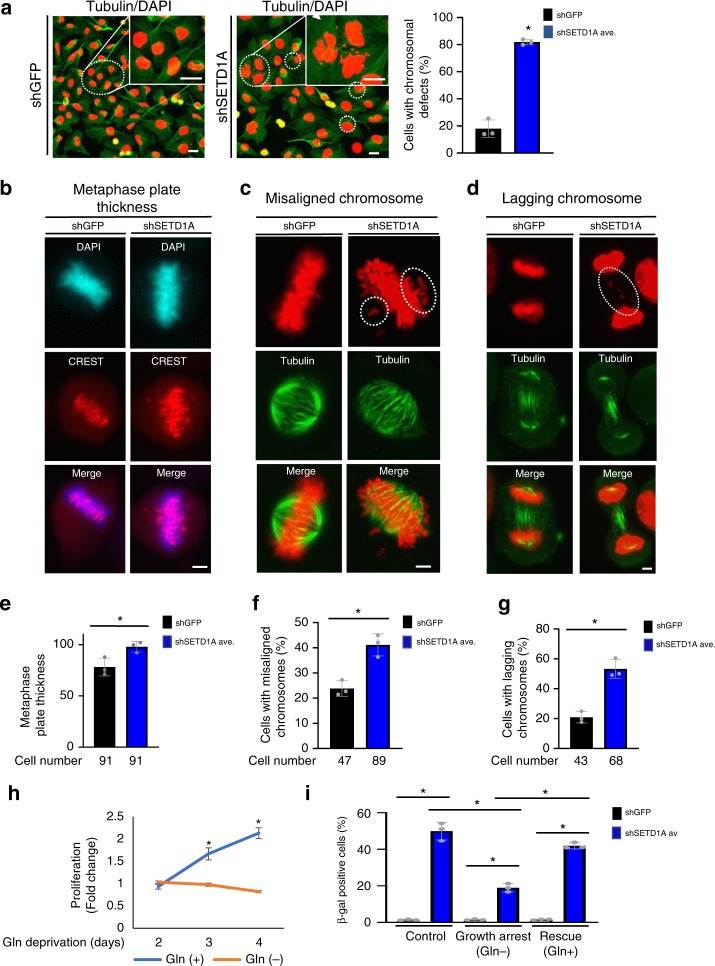
SETD1A expression is required for proper mitosis. a MDA-MB-231 cells were stained with an antibody against tubulin (green) and the nuclear stain, DAPI (red). Micronuclei resulting from chromosome segregation defects in SETD1A-KD cultures are highlighted with dashed circles. Scale bar represents 20 µm. Quantification of the fraction of cells with micronuclei/chromosome segregation defects are provided in the bar graph. Data from three independent experiments are presented as Mean + SD; *p < 0.05 by two-tailed unpaired Student’s t test. Source data are provided as a Source Data file. b shGFP- and shSETD1A-MDA-MB-231 cells were stained with antibodies against CREST protein to mark the centromeres (red). Nuclei were stained with DAPI (blue). Photomicrographs show poor alignment of chromosomes during metaphase increasing the plate thickness. The scale bar represents 5 µm. Source data are provided as a Source Data file. c, d shGFP- and shSETD1A-MDA-MB-231 cells were stained with antibodies against tubulin to mark the microtubules (green). Nuclei were stained with DAPI (red). Mitotic cells with mis-aligned chromosomes (c) and lagging chromosomes (d) are shown. Dashed circles highlight the defects in the shSETD1A cells. shGFP cells are shown as controls. The scale bar represents 5 µm. Source data are provided as a Source Data file. e–g: Bar graphs provide the quantification of each of the events shown in (b–d). Total number of mitotic cells evaluated under each category across three experimental replicates is provided below. shSETD1Aav represents the mean derived following infection with two different shSETD1A constructs. Data from three independent experiments are presented as Mean + SD; *p < 0.05 by two-tailed unpaired Student’s t test. Source data are provided as a Source Data file. h l-glutamine withdrawal blocks the proliferation of MDA- MB-231 cells. Each data point represents data from three independent experiments presented as Mean + SD; *p < 0.05 by two-tailed unpaired Student’s t test. Source data are provided as a Source Data file. i Inhibition of proliferation mitigates the senescence phenotype induced by SETD1A-KD. Senescence of SETD1A-KD cells grown in the presence and absence of L-glutamine (and to which glutamine was re-added after 24 hours after SETD1A-KD) was measured using ß–gal staining. Quantification of ß-gal positive senescent cells in shGFP and shSETD1Aav cultures. shSETD1Aav represents the average from using two different shSETD1A knockdown constructs for each shSETD1A construct. Data from three independent experiments are presented as Mean + SD; *p < 0.05 by two-tailed unpaired Student’s t test. Source data are provided as a Source Data file

