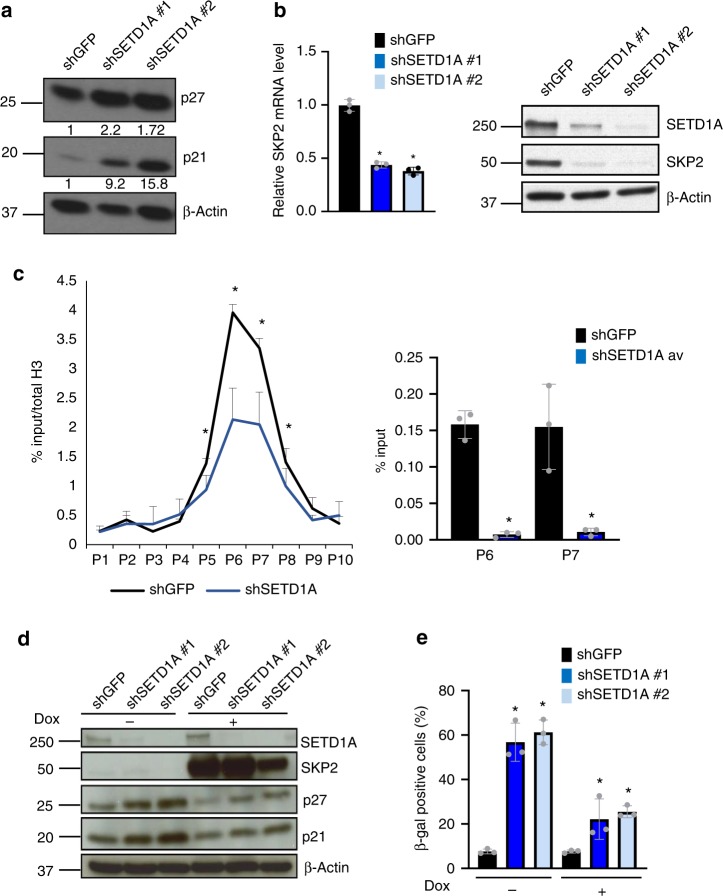
Fig. 5.
SKP2 mediates senescence-associated cell cycle arrest in SETD1A-KD cells. a Western blot analysis of shGFP- and SETD1A-KDcells shows induction of p21 and p27. ß-actin is shown as control. Quantification of the bands is provided below each blot. b SETD1A-KD suppresses SKP2 expression. Left: Bar graph shows the quantification of SKP2 mRNA in shGFP control and shSETD1A cells. Data from three independent experiments are presented as Mean + SD; *p < 0.05 by two-tailed unpaired Student’s t test. Source data are provided as a Source Data file. Right: Western blot analysis of SETD1A and SKP2 proteins in shGFP control and SETD1A-KD cells. ß-actin is shown as control. Source data are provided as a Source Data file. c Left panel: H3K4Me3 marks on the promoter region of SKP2 were analyzed using 10 primers (P1–P10) spanning the region in both control (shGFP) and SETD1A-KD cells. The results show that SETD1A-KD suppresses the H3K4Me3 marks on the SKP2 promoter. Right: Bar graph shows the quantification of SETD1A binding in the promoter regions evaluated with primers P6 and P7. shSETD1A data points represent the average derived from ChIP assays performed with cells individually infected with two different shSETD1A constructs. Data are represented as mean ± SD of the average of three experimental replicates. *p < 0.05 by Mann–Whitney U test. Source data are provided as a Source Data file. d Overexpression of SKP2 in SETD1A-KD cells suppresses the induction of p27 and p21. SETD1A expression was knocked down in cells following doxycycline-induced expression of SKP2 (Dox + ). The expression of p21 and p27 proteins in cells with and without SKP2 induction and in the presence and absence of SETD1A-KD is shown. ß-actin is shown as loading control. Source data are provided as a Source Data file. e Overexpression of SKP2 rescues the senescence phenotype. SETD1A expression was knocked down in cells following the induction of SKP2 expression (Dox + ) and the ß-Gal-positive cells were enumerated. Bar graph shows the percentage of ß-gal positive cells in uninduced and SKP2-induced cells following SETD1A-KD. Data from three independent experiments are presented as Mean + SD; *p < 0.05 by two-tailed unpaired Student’s t test. Source data are provided as a Source Data file

