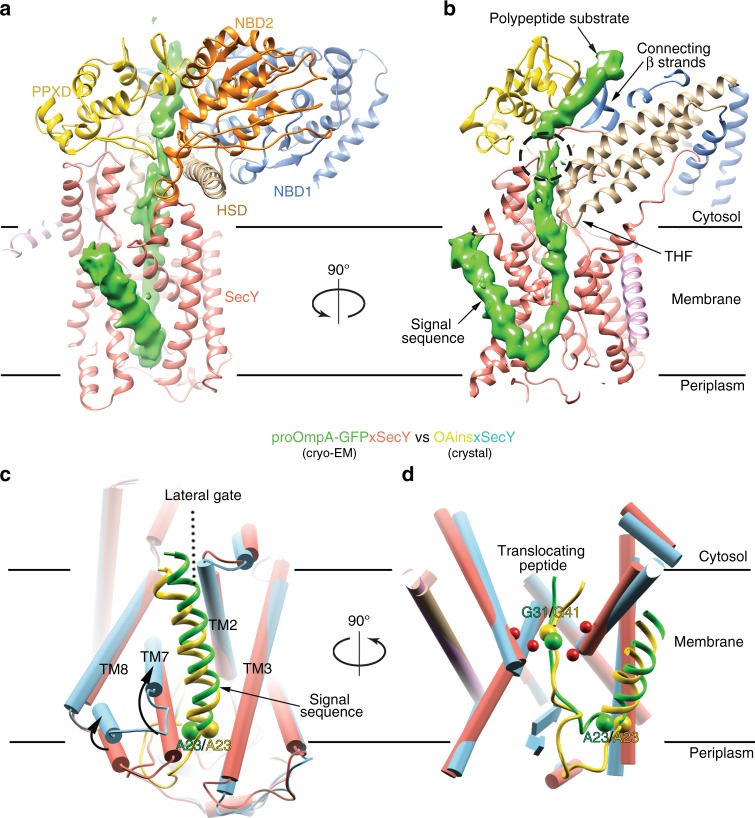
Fig. 3.
The translocating polypeptide in the SecA-SecY complex. a Density for the polypeptide (green) is shown in a ribbon diagram of the translocation complex. SecA domains are shown in different colors. b As in (a), but a cut-away view from a different angle. The dashed circle indicates a region where the substrate could not be traced, likely because it is flexible. c Comparison of the signal sequences and lateral gates between the cryo-EM and crystal (PDB ID: 5EUL) structures. SecY is shown as cylinders in salmon and cyan, respectively. The signal sequences are shown as ribbon diagrams, colored green and yellow for the cryo-EM and crystal structures, respectively. The movements of TM7 and TM8 are indicated by arrows. d As in (c), but cut-away side view from a different angle. The first residue after the signal sequence (Ala23) and the Gly residues trapped inside the pore rings (red balls) are labeled and shown as balls

