Fig. 3.
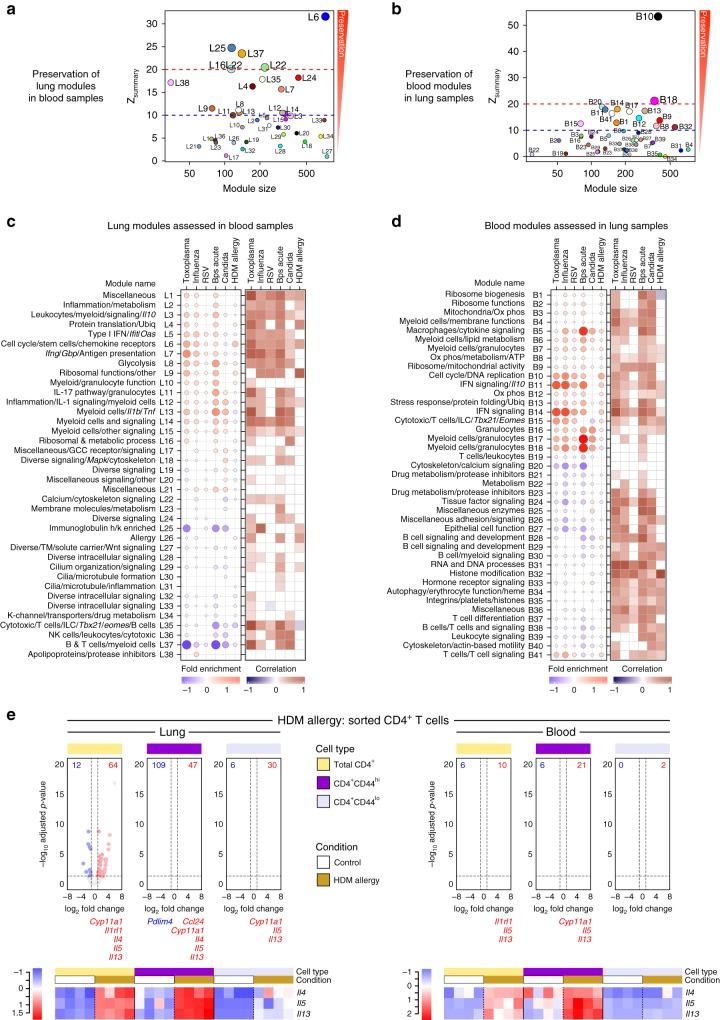
Comparison between the transcriptional profiles in lung and blood across diseases. a, b Modular preservation to assess the reproducibility and robustness of network topology of the lung modules in blood samples (a), and of the blood modules in lung samples (b) across the control and disease samples across all mouse models. Zsummary scores indicative of the degree of preservation were calculated in WGCNA using permutation testing, with scores >10 considered strongly preserved. Each circle represents a module indicated by the module number, with colors assigned in WGCNA for visual distinction. c, d Assessment of fold enrichment of the lung modules in blood samples (c), and of the blood modules in lung samples (d) in disease compared to controls. Red and blue circles indicate the cumulative over- or under-abundance of all genes within the module, for each disease compared to the respective controls. Color intensity of the dots represents the degree of perturbation, indicated by the color scale. Size of the dots represents the relative degree of perturbation, with the largest dot representing the highest degree of perturbation within the plot. Within each disease, only modules with FDR p-value < 0.05 were considered significant and depicted here. Pearson correlation of foldchanges for genes within the module (disease samples compared to respective controls) between lung and blood is shown, with dark red and blue squares representing positively and negatively correlated gene perturbations, respectively. Significance was calculated using a two-tailed probability of t-test values for each correlation, and adjusted for multiple tests within each disease. Only FDR p-values < 0.05 were considered significant and depicted here. GCC glucocorticoid, K-channel potassium channel, Ox phos oxidative phosphorylation, TM transmembrane, Ubiq ubiquitination. e Volcano plots depicting differential gene expression for all genes, in HDM allergy compared to controls, in sorted CD4 T cells (total CD4+, CD4+CD44hi, and CD4+CD44lo) from lung and blood samples. Significantly differentially expressed genes (log2 fold change >1 or <−1, and FDR p-value < 0.05) are represented as red (up-regulated) or blue (down-regulated) dots. The numbers of down- (in blue) or up-regulated (in red) genes are listed in the volcano plot. Below each volcano plot, the genes significantly differentially expressed in the 121 genes in the L26 Allergy module are shown in red (up-regulated) or blue (down-regulated). Heatmaps are shown for log2 gene expression values for Il4, Il5, and Il13. Gene expression values were averaged and scaled across the row to indicate the number of standard deviations above (red) or below (blue) the mean, denoted as row Z-score

