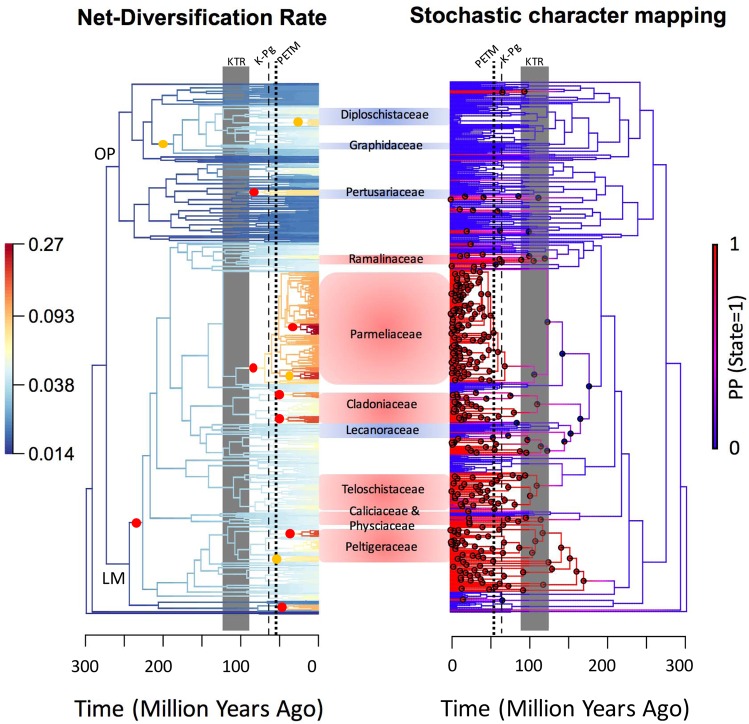
Figure 1.
Changes in diversification dynamics through time (left) and the evolutionary history of microlichen versus macrolichen (right). Branch color of the left figure depicts the net-diversification rate estimated from a BAMM analysis with a warmer color indicating higher rates. Color dots in the left panel indicate the positions where diversification rate has shifted (red dots indicate a marginal shift probability >0.5 and yellow dots >0.3). Branch color of the right figure depicts the probability of being state 1 (macrolichen), where a warmer color indicates a higher probability. Pie charts on nodes indicate the estimate trait states, where only nodes with >10% estimated probability of being macrolichens are shown. Dash lines in both figures indicate the K-Pg boundary (66 MYA) and the Paleocene-Eocene thermal maximum (PETM); the grey shaded areas indicate the period of rapid angiosperm diversification (KTR). LM = Lecanoromycetidae, OP = Ostropomycetidae.

