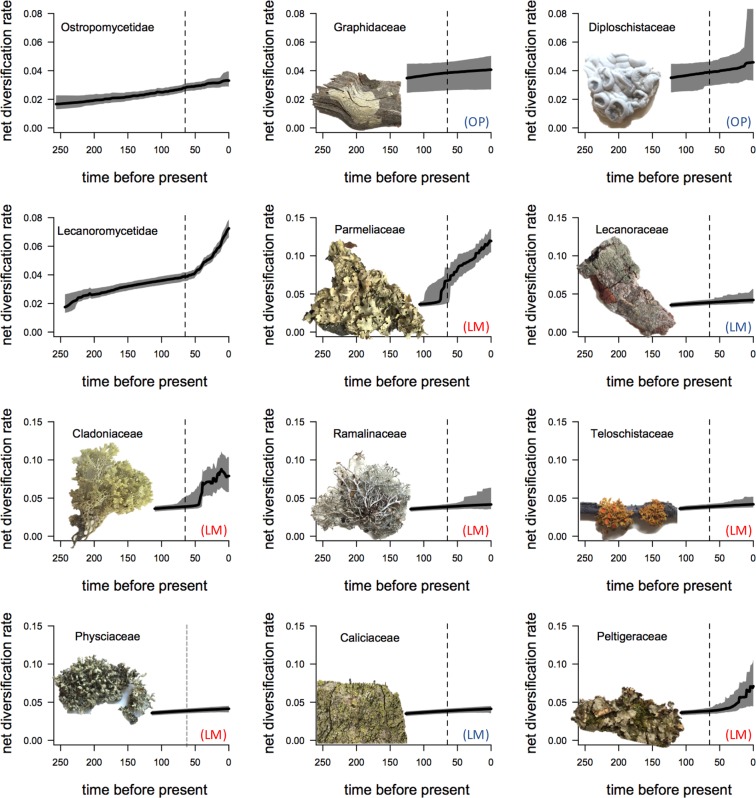
Figure 2.
Net-diversification rate through time plots of the two subclasses and families with more than 500 species in these two main subclasses of lichen-forming fungi. Solid lines are the mean net-diversification rates and the grey areas depict the 95% probability densities. Vertical dash lines indicate 66 MYA. LM = Lecanoromycetidae, OP = Ostropomycetidae. Red color = lineages that are mostly macrolichens, blue color = microlichen lineages.

