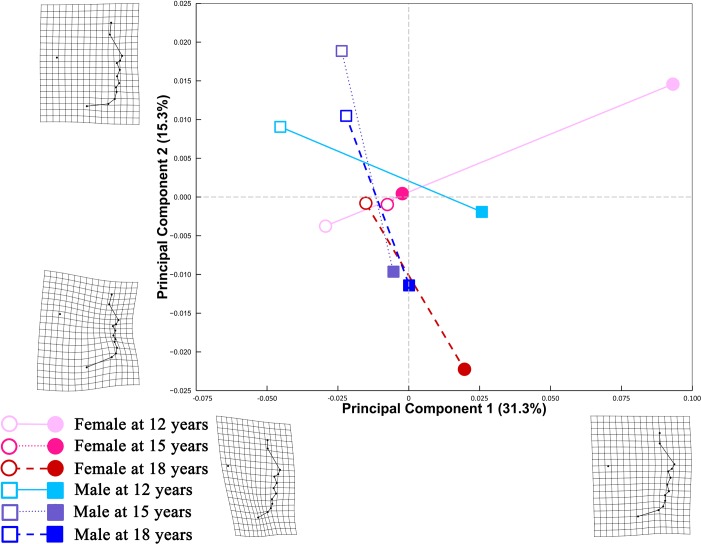
Fig 5. Allometric trajectories for each age-by-sex group in the first two PCs.
Lateral facial shapes were estimated at the smallest and largest In(CS) of each age-by-sex group. Lines extending from the predicted mean shape at the smallest In(CS) (open symbols) to the predicted mean shape at the largest In(CS) (solid symbols) are two dimensional representations of the static allometric trajectories that exist in the multidimensional shape space. The relative amount of shape variation explained by the first two PCs are shown as percentages. TPS grids along the axes illustrate shape differences between individuals with low/high scores along either PC and the grand mean shape, with ×2.5 magnification.

