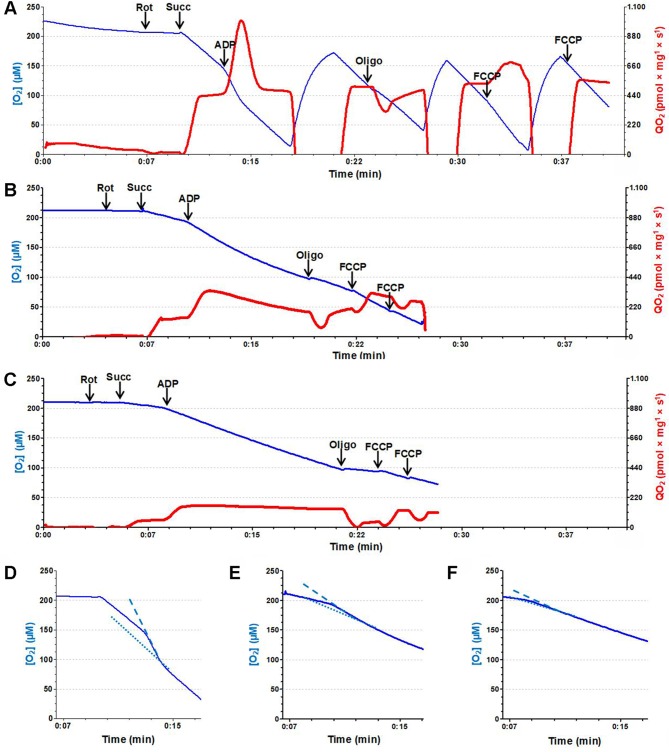
Fig 5. Oxygen consumption (QO2).
Representative recordings of QO2 of mitochondria isolated from Sham (A), CL (B) and UUO (C) mice. Blue traces correspond to evolution of [O2] (left ordinates) in the incubation media, and the repeated recovery of levels near 150 μM after rapid exhaustion in (A) are the result of the chamber opening and equilibration of the medium with air. Red traces correspond to the evolution of QO2 values (right ordinates) at the times shown on the abscissae, after additions indicated by vertical heavy arrows. Abbreviations: rot, 0.5 μM rotenone; succ, 10 mM succinate; ADP, 150 μM ADP; oligo, 0.5 μM oligomycin; FCCP, 1.5 μM FCCP. (D, E, F) Traces correspond to the [O2] evolution in A, B and C, respectively, at the times indicated on the abscissae. The slopes of the lines gives a better comparison between the rates of [O2] decrease during state 3 (dashed) and state 4 of respiration (dotted) in Sham (D), CL (E) and UUO (F) groups.

