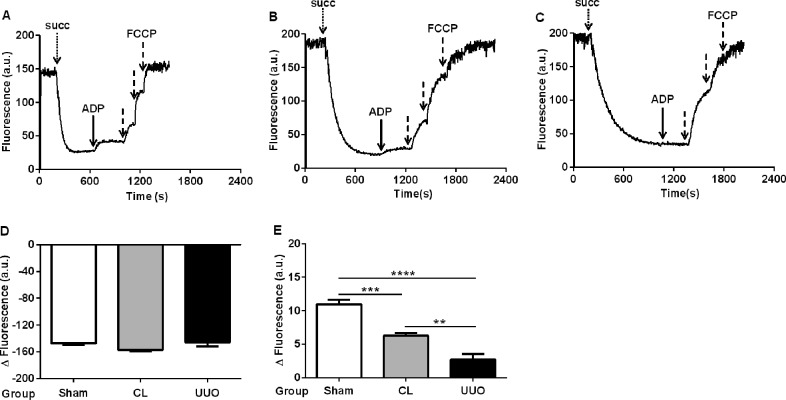
Fig 6. Time-course of the mitochondrial membrane potential (Δψm) and its response to ADP.
(A, B, C) Representative traces obtained of Sham, CL and UUO mitochondria, respectively. The additions were: 10 mM succinate (succ, dotted arrow), 500 μM ADP (heavy arrow) and 0.5 μM FCCP (dashed arrows). (D) Quantification (means ± SEM) of the change in the intensity of fluorescence signals from baseline recorded after addition of succinate and before the ADP pulse, using Sham, CL and UUO mitochondria as shown (n = 5 preparations of kidneys from each group). (E) Amplitude of the fluorescence changes (depolarization) after addition of the ADP pulse in the 3 groups. **p<0.01, ***p<0.001, ****p<0.0001, assessed by ANOVA followed by Tukey’s test.

