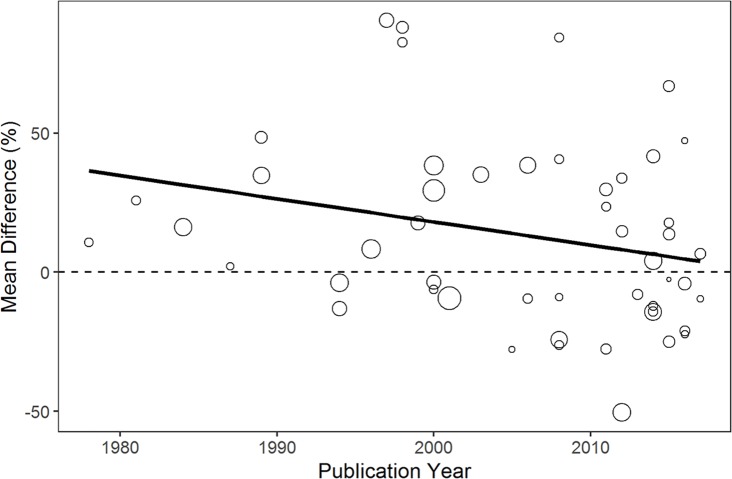
Fig 4. Random-effects univariate meta-regression between publication year and the mean difference between helminth-polyparasitized and helminth-monoparasitized individuals.
Each circle represents a study and the circle size is representative of its weight (inversely proportional to the variance of that study) in the meta-regression analysis. The solid line indicates the regression prediction (coefficient -0.008 [95% CI -0.017–0.001], p = 0.072). The dashed line indicates an equal number of polyparasitized and monoparasitized individuals in the study, while study estimates above or below zero indicate a greater or lesser number of polyparasitized individuals when compared to monoparasitized individuals, respectively.

