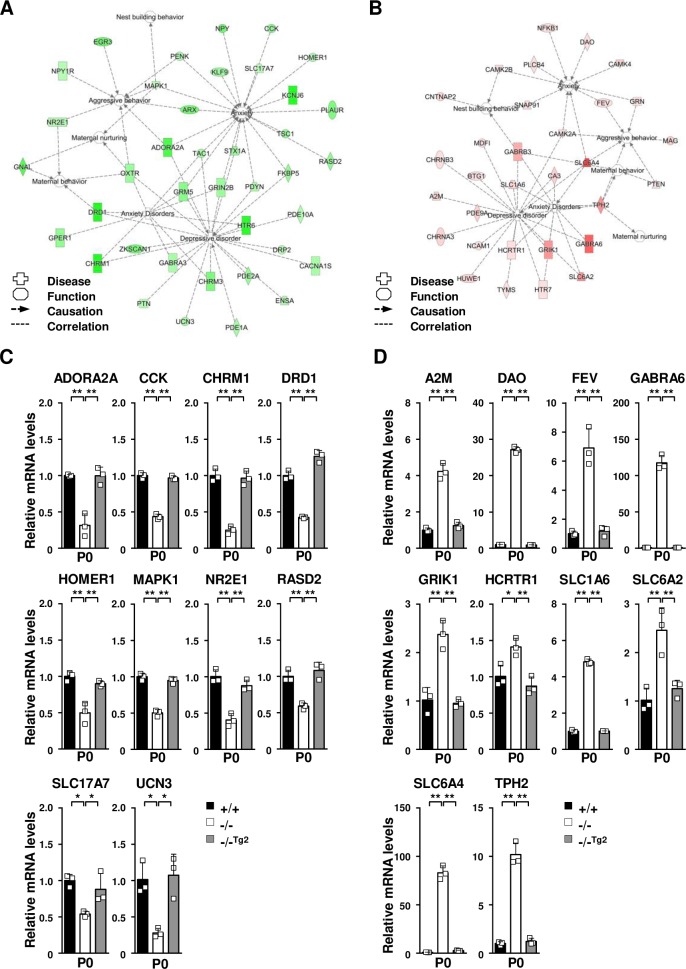
Fig 6. Altered gene expression in the brain tissue of TDAG51-/- dams after parturition.
(A) Prediction of the functional networks of the 39 downregulated genes listed in Table 1. Node color intensity indicates the degree of the downregulation of gene expression as follows: a greater intensity of green represents a higher degree of downregulation. Inverted triangle, kinase; dotted square, growth factor; vertical rectangle, G-protein coupled receptor; dotted vertical rectangle, ion channel; horizontal rectangle, ligand-dependent nuclear receptor; vertical diamond, enzyme; trapezoid, transporter; horizontal ellipse, transcription regulator; circle, other. (B) Prediction of the functional networks of the 31 upregulated genes listed in Table 2. Node color intensity indicates the degree of the upregulation of gene expression as follows: a greater intensity of red represents a higher degree of upregulation. (C) Real-time PCR analysis of downregulated genes selected from the list shown in Table 1. Total RNA isolated from brain tissues was analyzed using real-time PCR with specific primers. Black bar (+/+), TDAG51+/+ dams. White bar (-/-), TDAG51-/- dams. Gray bar (-/-Tg2), TDAG51-/-Tg2 dams. (D) Real-time PCR analysis of upregulated genes selected from the list shown in Table 2. *p<0.05. **p<0.01.

