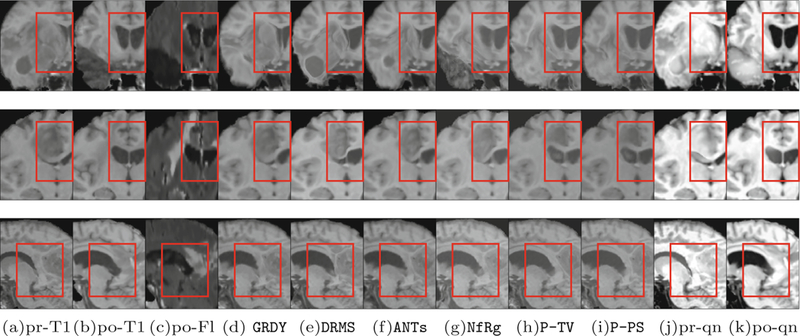
Fig. 2.

Example registration results from three patients. (a) and (b) show the pre and the post T1 scans. (c) shows the post T2-FLAIR scans, only for visualization purposes. (d)-(i) show registration results of pre to post from GREEDY, DRAMMS, ANTs, NiftyReg, PCA-TV, and our patient-specific model, PCA-PS. In addition, (j) and (k) show the quasi-normal reconstructions of the pre and post scans, respectively. The red box highlights major differences. (Color figure online)
